
Fig. 6.
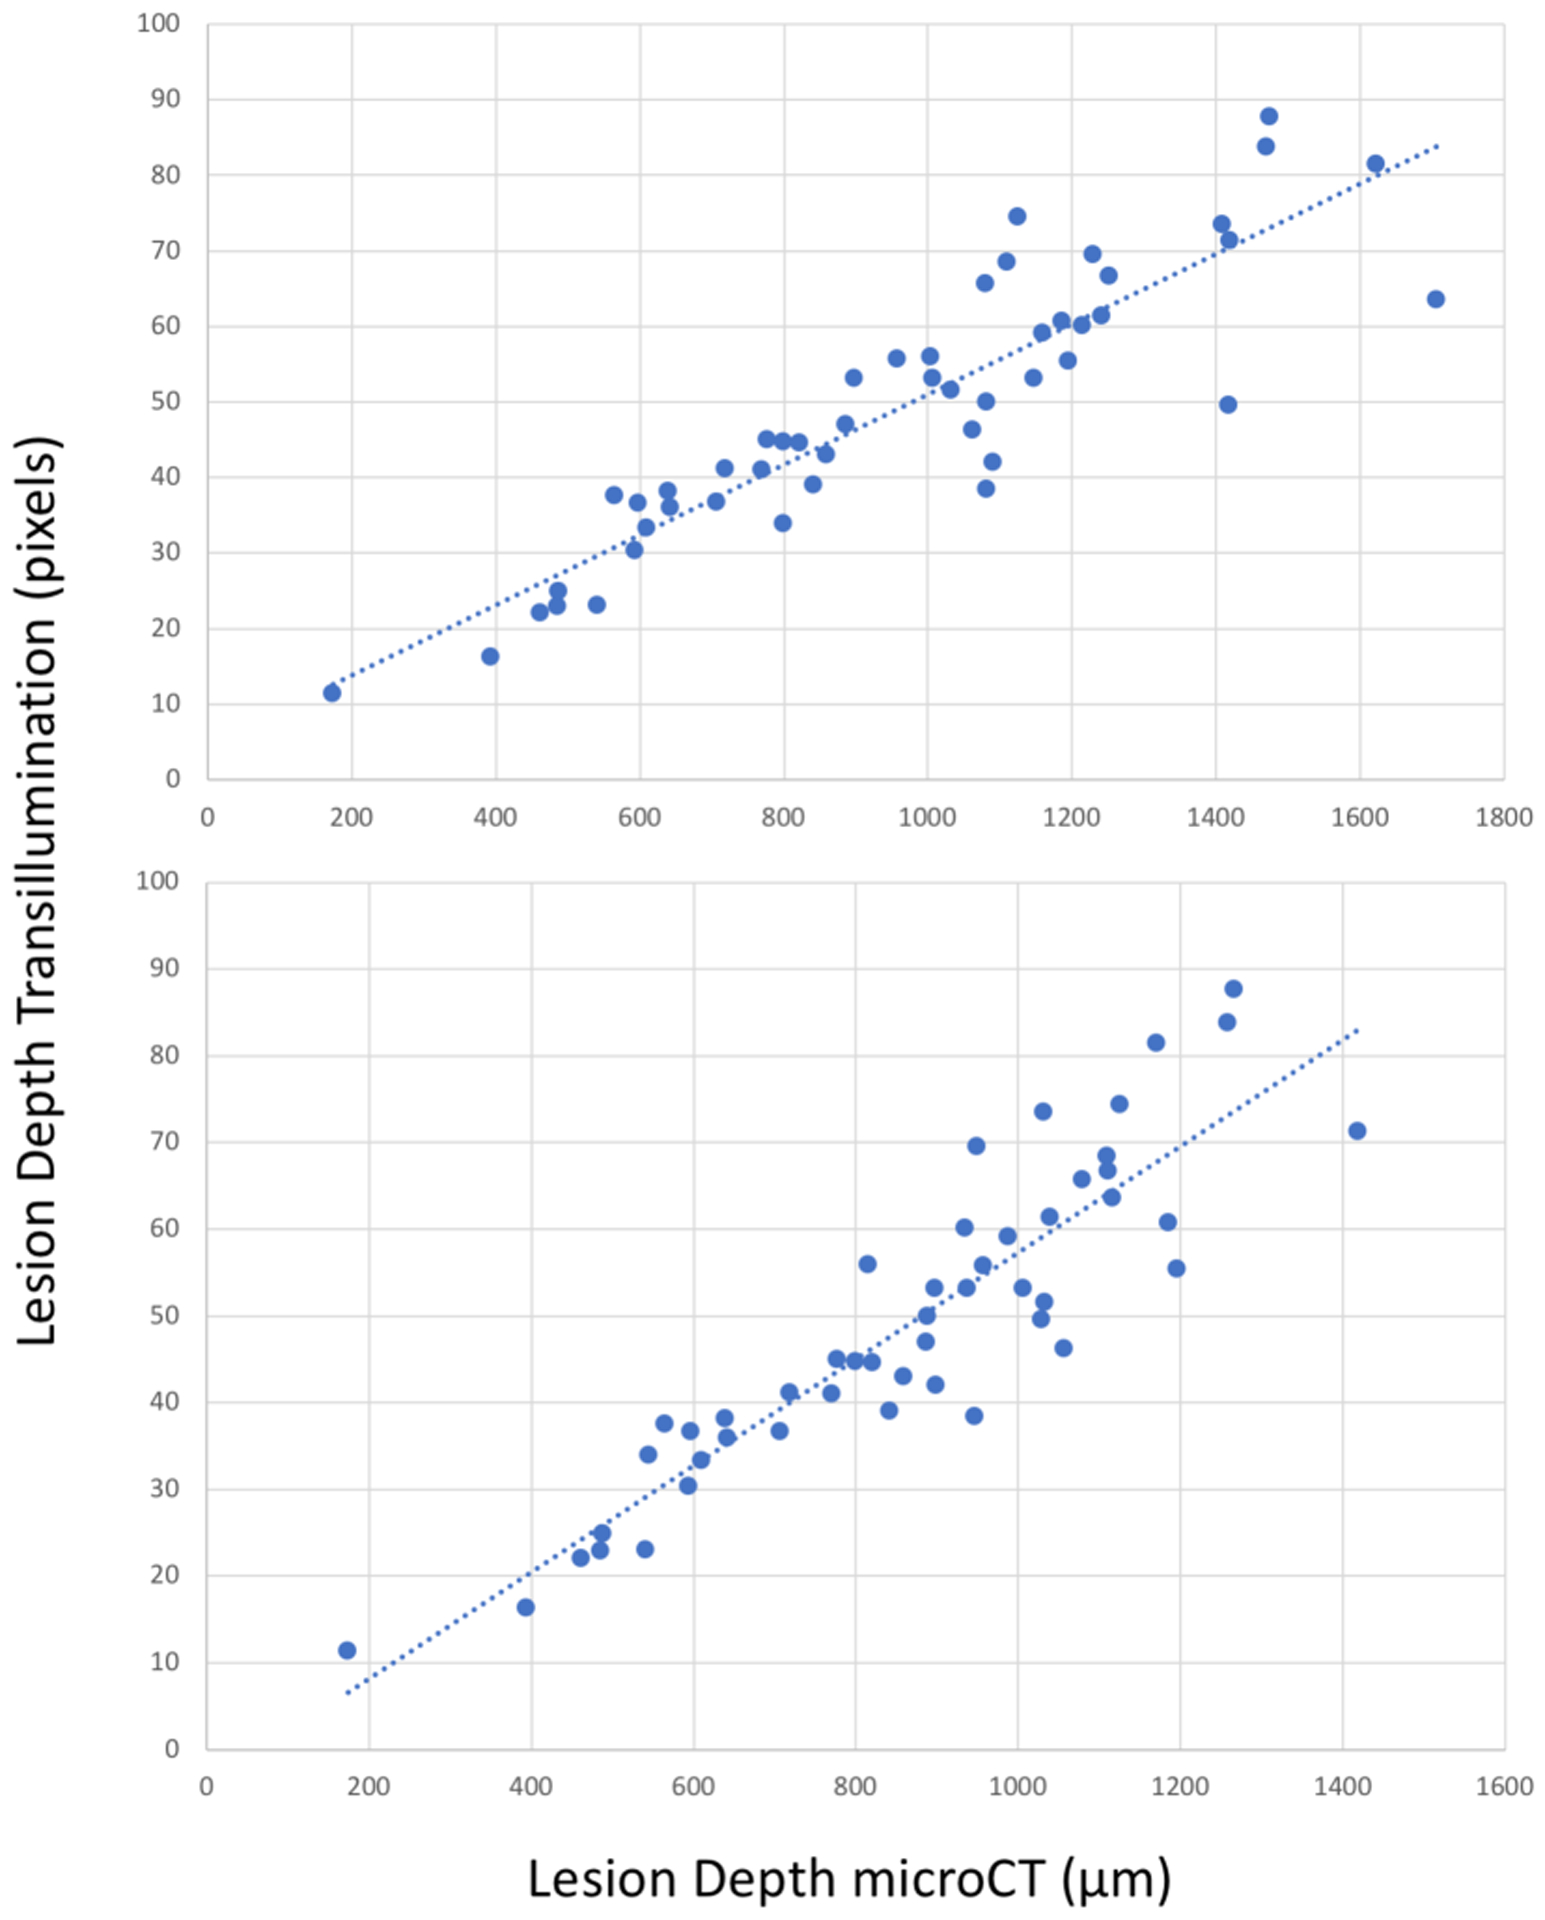
Interproximal lesion depth measured from the proximal surface in transillumination mode versus microCT. (top) Lesion depth measured with microCT and (bottom) cutoff at DEJ in microCT. There is high correlation with microCT (blue dotted lines) R2=0.81 and 0.82 (P<0.05).