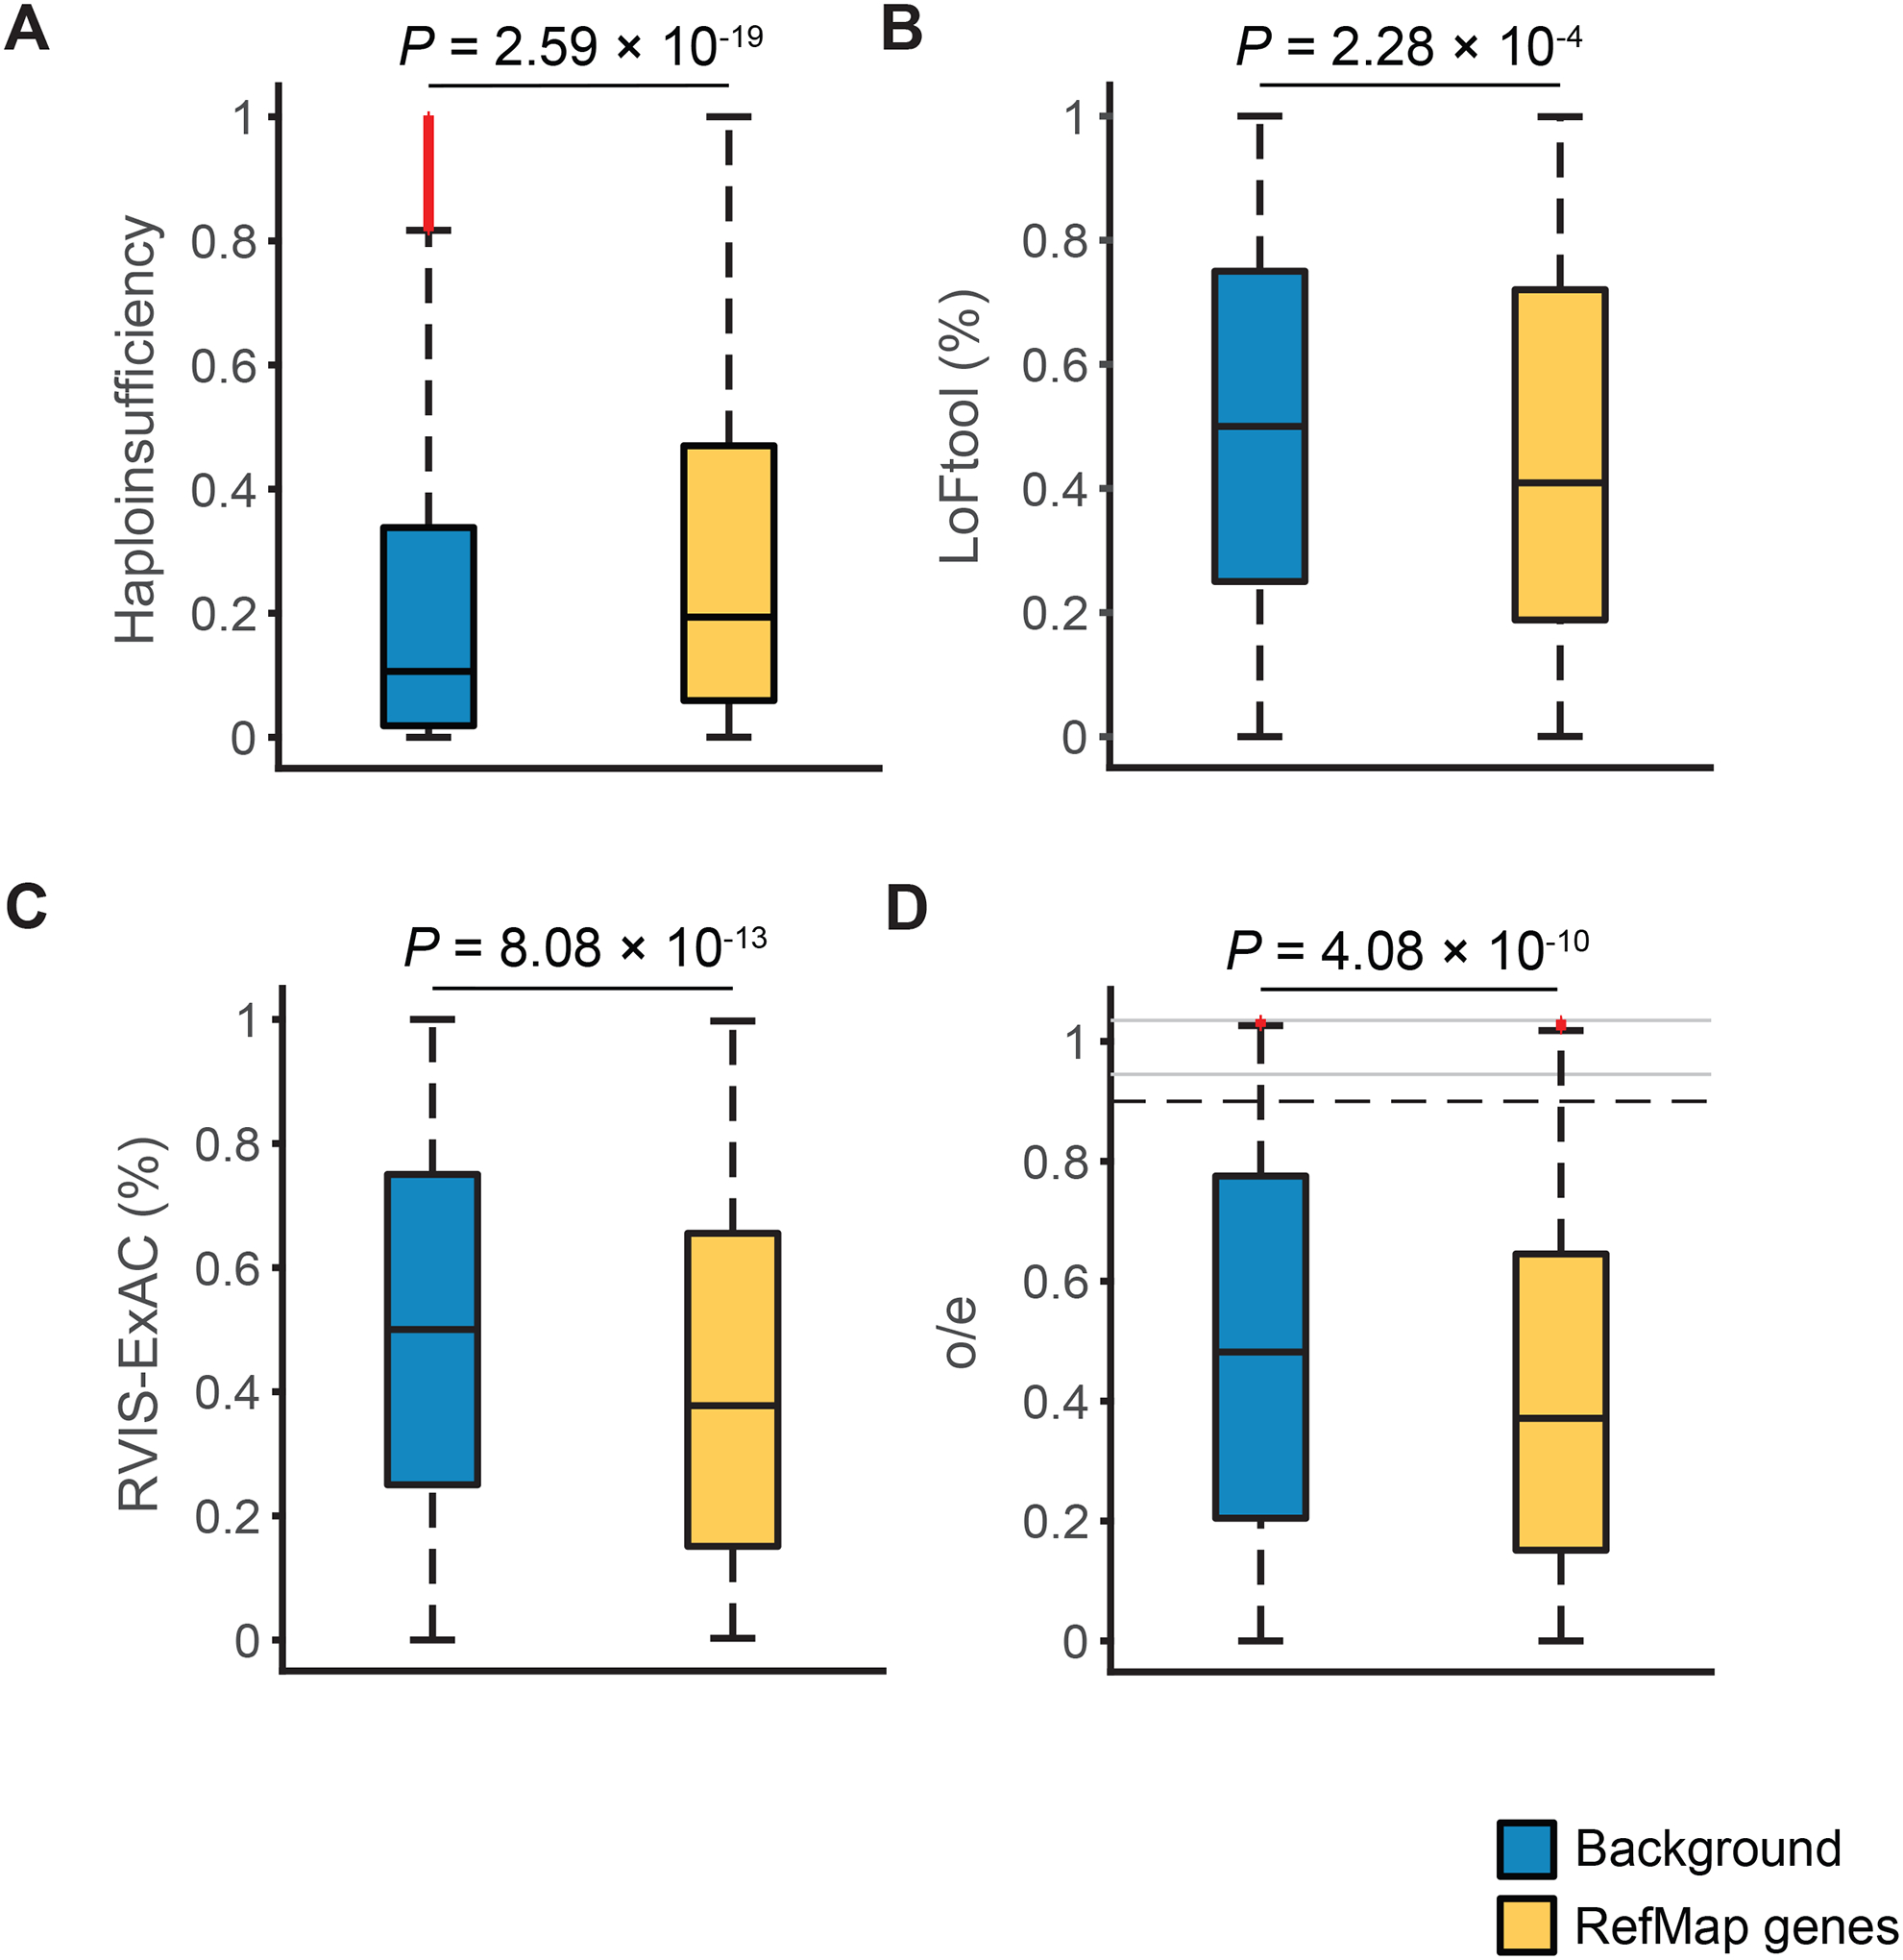
Figure 2. RefMap genes are haploinsufficient and intolerant to loss of function.

(A-D) Comparison of haploinsufficiency score (A), LoFtool percentile (B), RVIS-ExAC percentile (C), and o/e score (D) between RefMap genes and all protein-coding genes in the background transcriptome. Comparison was performed using the one-sided Wilcoxon rank-sum test. The bottom and top of the boxes indicate the first and third quartiles, respectively, where the black line between indicates the median. Whiskers denote the minimal value within 1.5 interquartile range (IQR) of the lower quartile and the maximum value within 1.5 IQR of the upper quartile. Red symbols denote outliers. In D, black dashed lines indicate the lower and upper limits of the regions with regular scale. Outliers beyond the black dashed lines are visualized with a compressed scale in the regions denoted by gray lines. See also Figures S2B and S2C.
