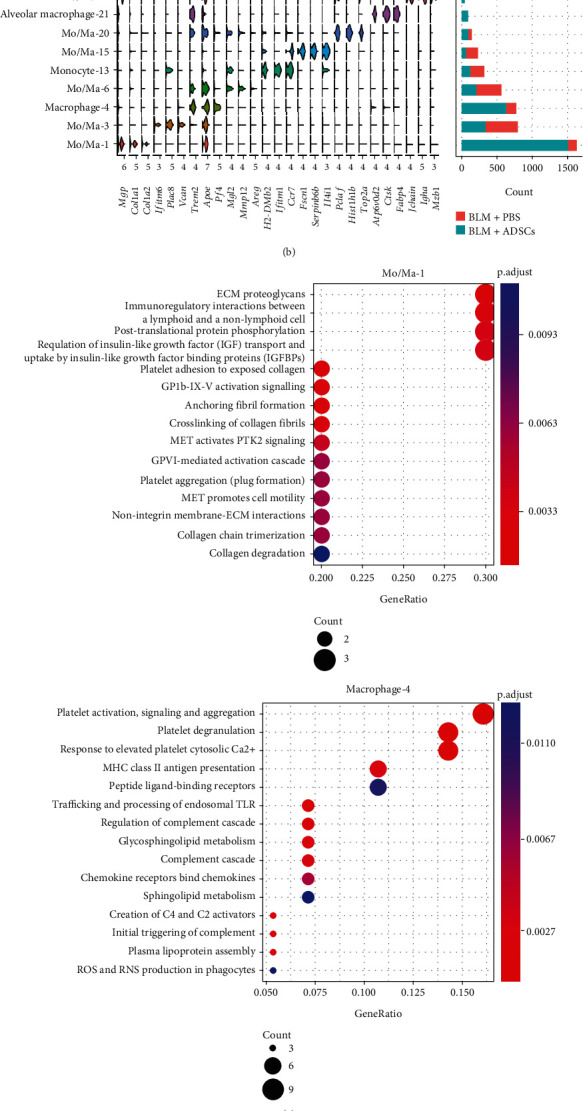
Figure 3.

ADSC injection changed composition of macrophage population in BLM-treated lung. (a) UMAP distribution of 9 monocyte/macrophage clusters in lung-originated cells, merging the BLM + ADSCs group and BLM + PBS group. (b) Stacked violin plot of cluster marker genes (top three marker genes for each cluster) and cell count of monocyte/macrophage clusters. (c) REACTOME pathway analysis of marker genes of Mo/Ma-1 and macrophage-4 clusters. Genes are filtered by a condition of log2 fold change >0.5 and adjusted P value <0.1. (d) Immunofluorescence images of APOE and TREM2 which the highly expression genes in macrophage-4 on day 7 post BLM treatment.
