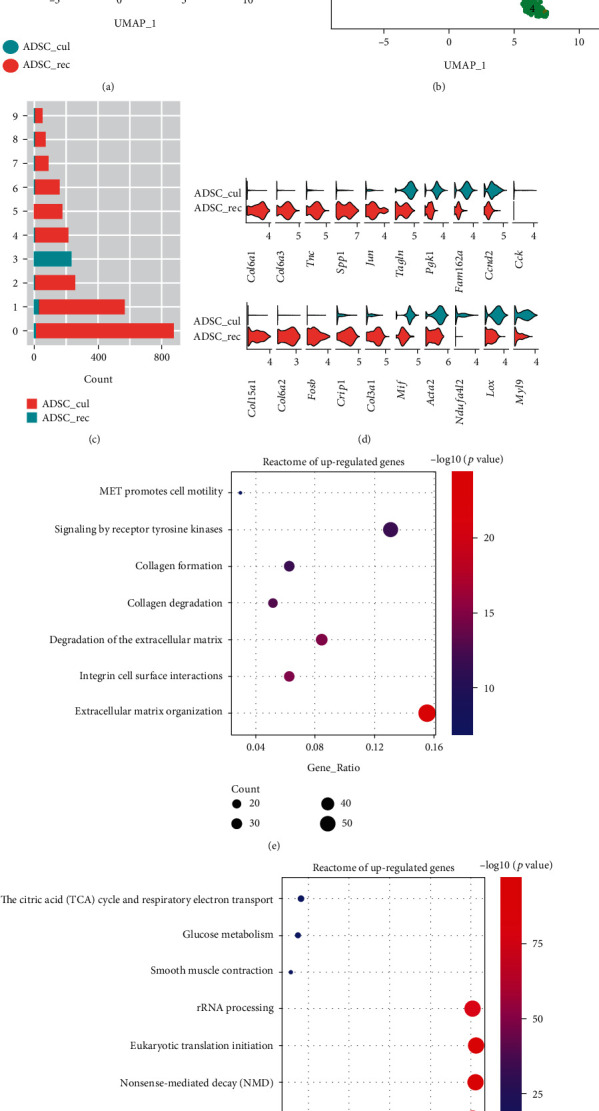
Figure 4.

Recollected (ADSC_rec) ADSCs showed a different single-cell transcriptomic profile compared to cultured ADSCs (ADSC_cul). (a) UMAP distribution of in vitro cultured (ADSC_cul) and recollected (ADSC_rec) ADSCs merged into one dataset. (b) UMAP distribution of all 10 clusters identified by Seurat in merged dataset of ADSC_cul and ADSC_rec. (c) Cell count of every cluster in two ADSC groups. (d) Violin plots of differentially expressed genes between ADSC_cul and ADSC_rec groups. (e, f) REACTOME pathway enrichment terms of differentially expressed genes ((e) upregulated genes, (f) downregulated genes) in ADSC_rec group compared to ADSC_cul group. Genes were first filtered by a condition of log2 fold change >0.5 or < -0.5 and adjusted P value <0.05.
