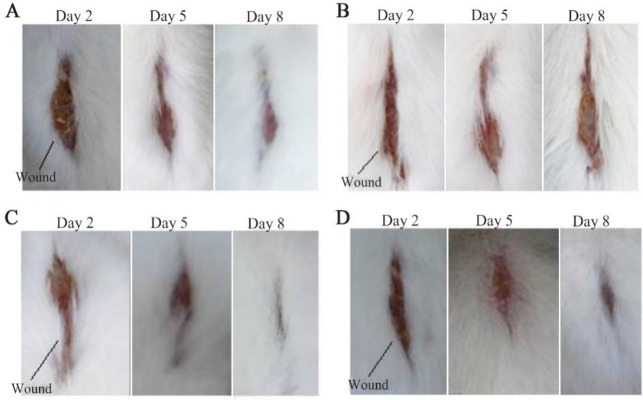
Figure 3.
Wound condition of mice on days 2, 5, and 8 after being injured. Taking pictures using a camera with a resolution of 20 Megapixel. A) Wound condition of control mice that had blood glucose levels measured before treatment was 159 mg/dL and after treatment 172 mg/dL, where the wound area on day 8 was 0.32 cm2. B) Wound condition of control mice that had blood glucose levels measured before treatment was 177 mg/dL and after treatment 198 mg/dL, where the wound area on day 8 was 0.60 cm2. C) The condition of the mice's wounds that were given electrical stimulation and had blood glucose levels measured before treatment was 187 mg/dL and after treatment 177 mg/dL, where the wound area on day 8 was 0.04 cm2. D) The wound condition of mice that were given electrical stimulation and had glucose levels measured before treatment was 197 mg/dL and after treatment 172 mg/dL, where the wound area on day 8 was 0.10 cm2.

