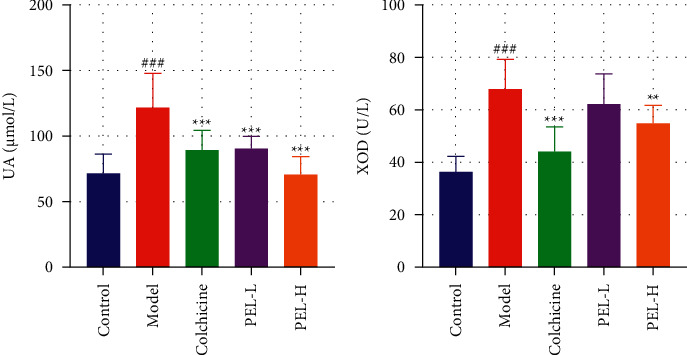
Figure 3.

Changes in UA and XOD in serum of rats in each group after treatment (x̄ ± s, n = 9). (a) Rat serum UA value. (b) Rat serum XOD activity value. Compared with the blank group, ###P < 0.001; compared with the model group, ∗∗P < 0.01, ∗∗∗P < 0.001.
