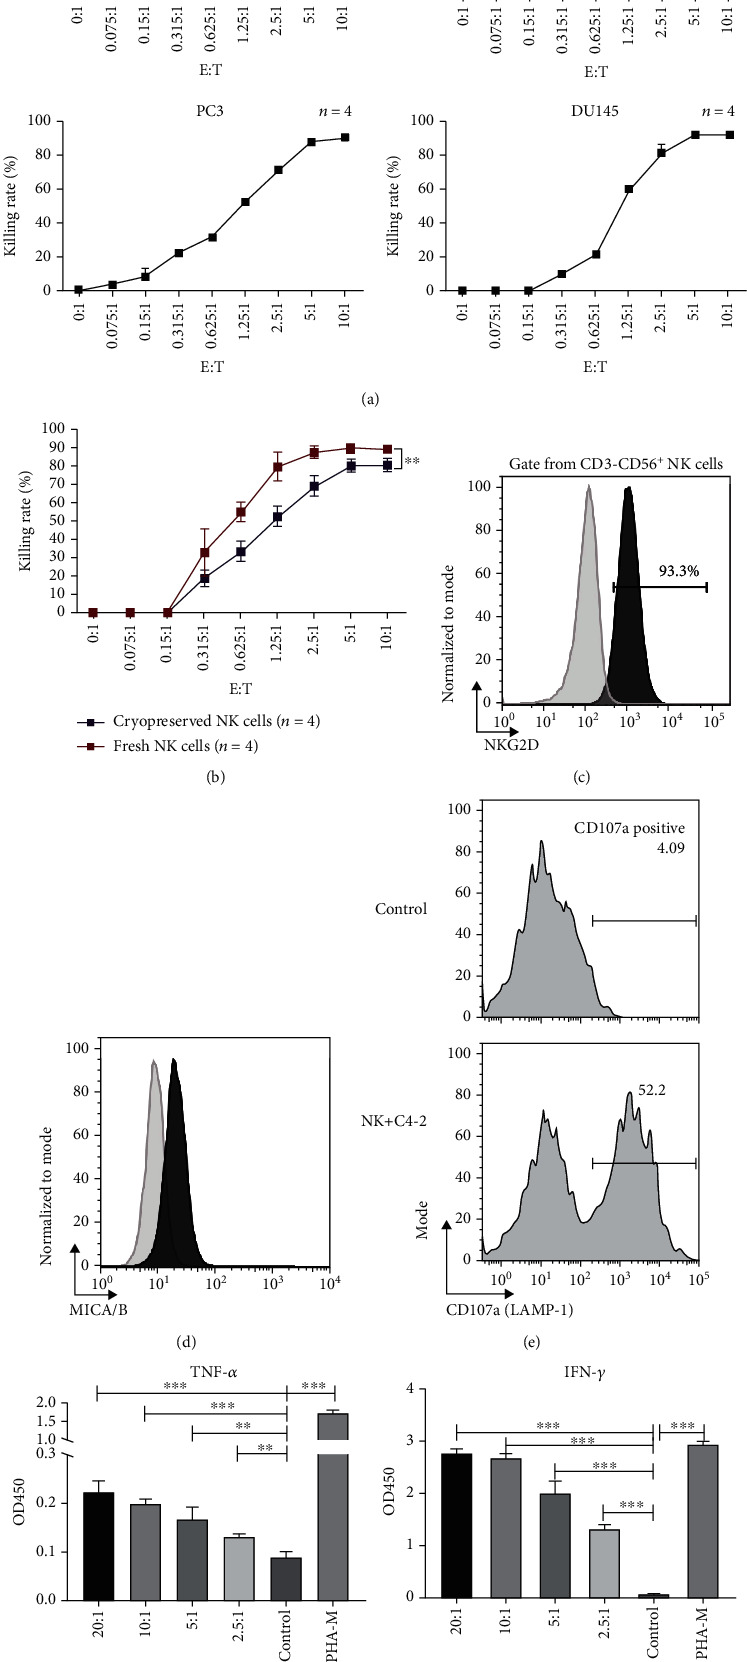
Figure 2.

Cytotoxicity, degranulation activity, and cytokine secretion of the expanded NK cells. (a) Killing rates of the NK cells against multiple prostate cancer cell lines including C4-2, LNcap, PC-3, and DU-145 at different E/T ratios after 24 h coculture. Data are shown as means ± SD (n = 4 technical replicates). E/T: effector-to-target ratio. (b) Comparison of killing rates against the C4-2 cell line between fresh NK cells and 1 month cryopreserved NK cells at different E/T ratios. Data are shown as means ± SD (n = 4 technical replicates). ∗p < 0.05. E/T: effector-to-target ratio. (c) Representative flow cytometry plots and data of NKG2D expression on CD3−CD56+ NK cells. NKG2D: NK group 2 member D. (d) Representative flow cytometry plots and data of MICA/B expression on C4-2 cells. MICA/B: MHC class I chain-related protein A/B. (e) Representative flow cytometry plots and data of CD107a expression on the NK cells after being cocultured with C4-2 cells and NK cell alone. (f) IFN-γ and TNF levels of the supernatant after the NK cells were cocultured with C4-2 cells at E/T ratios of 2.5 : 1, 5 : 1, 10 : 1, and 20 : 1 or stimulated with PHA-M for 12 hours. Values are expressed as the means ± SD, ∗∗p < 0.01; ∗∗∗p < 0.001. OD: optical density; E/T: effector-to-target ratio; PHA-M: phytohemagglutinin-M.
