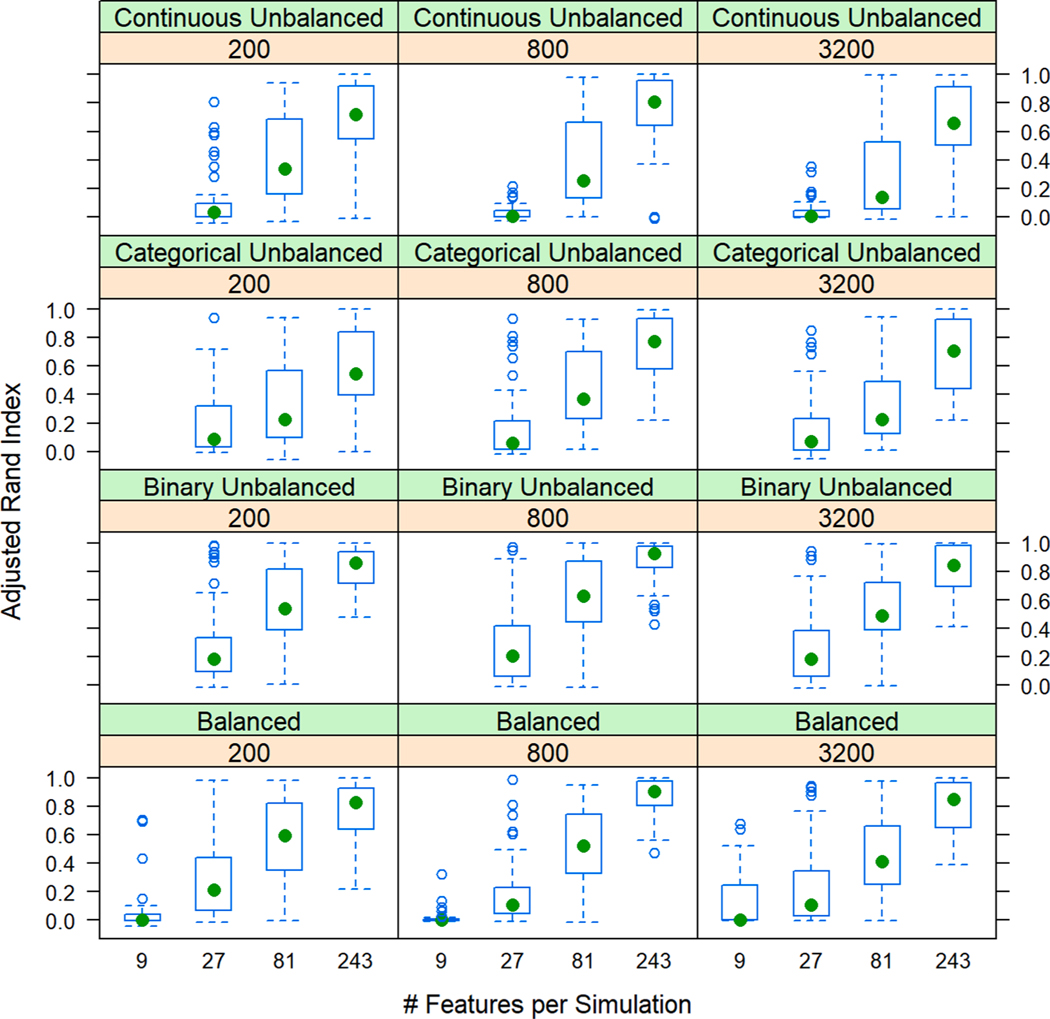
Fig. 3. Lattice box plot of Adjusted Rand Index (ARI) of mixed-type simulations by number of features and patients with hierarchical clustering and the DAISY algorithm.
Four distinct mixtures of data were plotted with the DAISY dissimilarity algorithm with hierarchical clustering, an algorithm-distance pair with superior performance across data mixtures. Across data types and algorithms, ARI varied strongly by number of features, but not by number of patients: lowest in simulations with 9 features and highest in simulations with 243 features. Intermediate feature spaces displayed higher degrees of variability, represented by broad spectra of ARI across many simulations.

