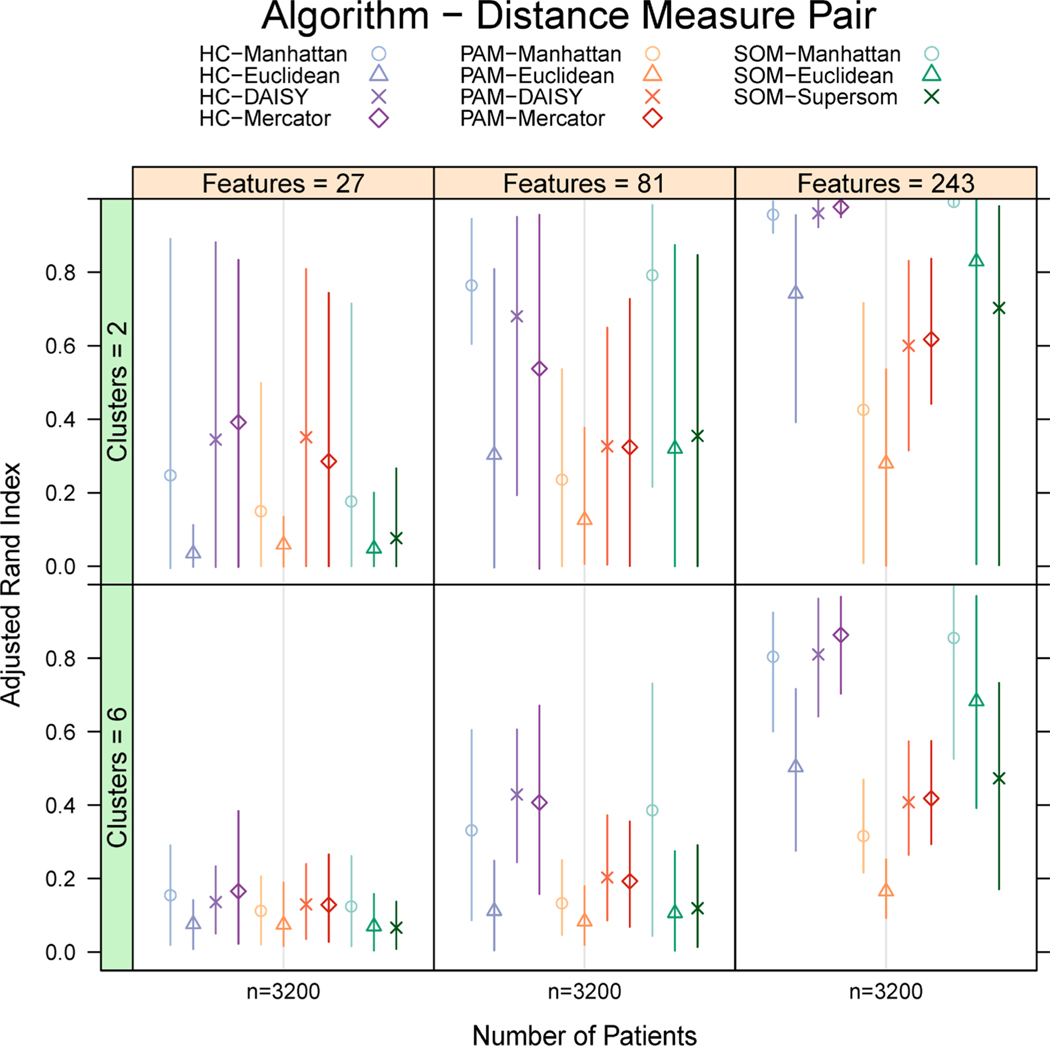
Fig. 4. Lattice box plot of Adjusted Rand Index (ARI) of 11 algorithm-distance measure pairs on large (3,200 patients), balanced, mixed-type simulations by number of features and clusters.
ARI is presented as mean (symbol) with bars extending to the 10th and 90th percentile. ARI increases with increasing number of features. Simulations with 6 clusters present with decreased mean ARI but contracted ARI range. With 81 or 243 features, the Manhattan, DAISY, and Mercator distances generate higher ARI than Euclidean distance within each algorithm. PAM shows the lowest mean ARI across feature and cluster combinations. HC and SOM produce solutions with elevated ARI, though SOM presents with wide ranges in some contexts.

