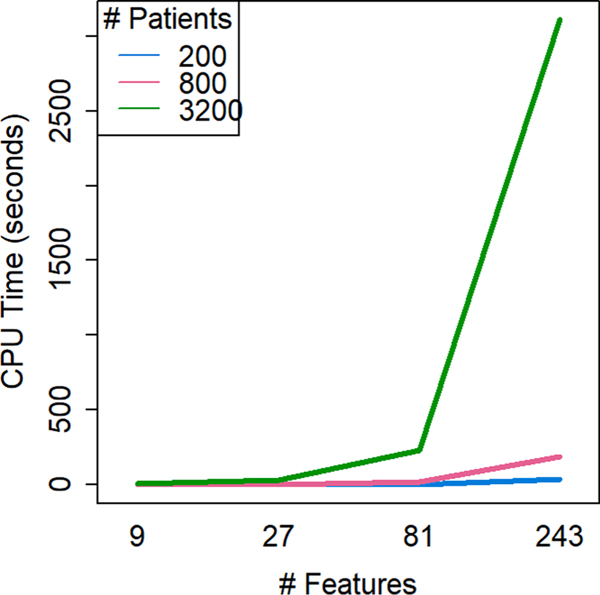
Fig. 5. CPU time to calculate the DAISY dissimilarity from the interaction of number of patients and number of features in a simulation.
DAISY displayed high variability in run time (372.461 ± 983.599 s). Computational time increased with the interaction of both number of patients and number of features as dataset size increased.

