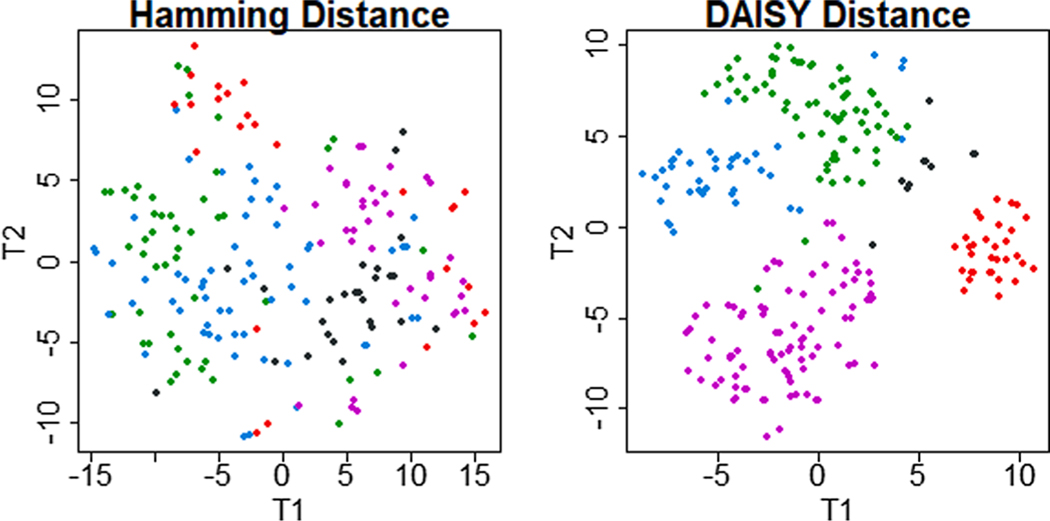
Fig. 6. Comparison of T-distributed Stochastic Neighbor Embedding visualizations of clusters obtained from the same mixed-type data set with a single-distance and a multiple-distance solution.
Clinical data from 21 mixed features on 247 patients with chronic lymphocytic leukemia was clustered with two methods. First, it was transformed to a binary matrix and clustered with the Hamming distance (left). Second, untransformed, mixed data were clustered with DAISY dissimilarity algorithm (right). The Hamming solution recover amorphous groupings without clear separation. The DAISY solution recovered 4 distinct clusters and a small grouping of outliers.

