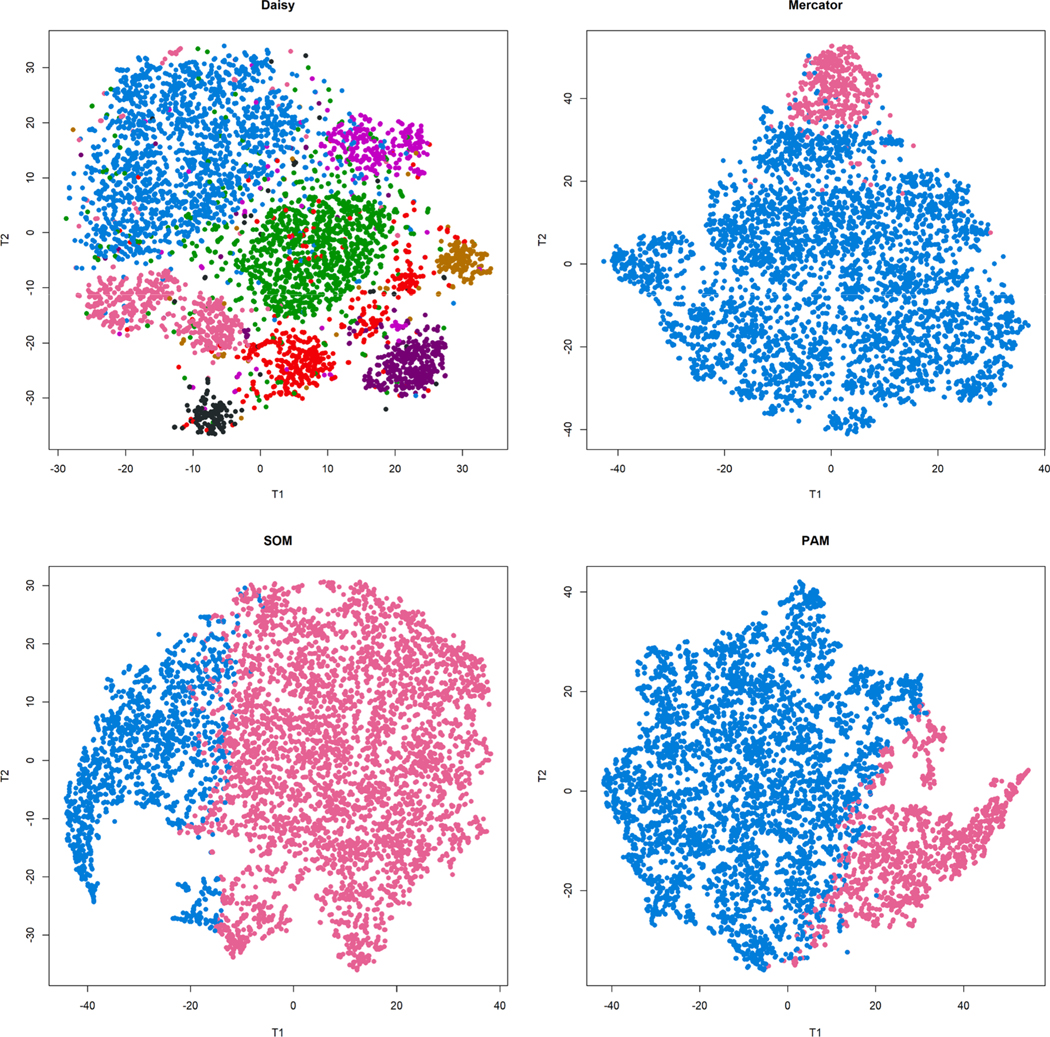
Fig. 7. Comparison of four methods used to cluster MIMIC-III data.
(Top left) DAISY distance with hierarchical clustering identified 8 clusters. The other three methods each identified only two clusters. (Top right) Mercator distance with hierarchical clustering. (Bottom left) Manhattan distance with self-organizing maps (SOM). (Bottom right) Euclidean distance with partitioning around medoids (PAM).

