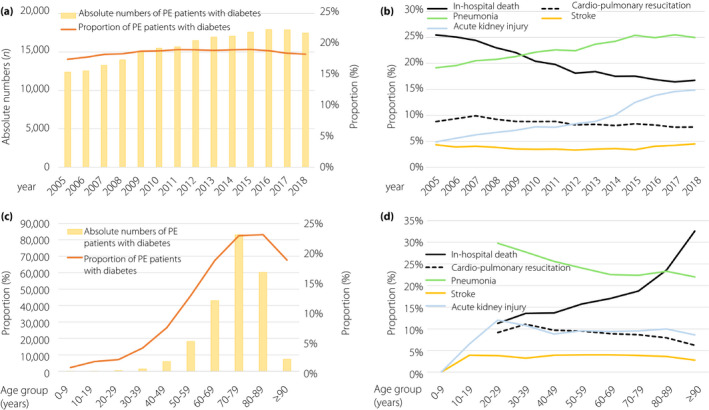
Figure 1.

Temporal trends regarding absolute numbers and relative rate of pulmonary embolism (PE) with diabetes and adverse outcomes. (a) Temporal trends regarding absolute numbers of PE with diabetes (yellow bars) and proportion of PE patients with diabetes related to all PE patients (orange line) stratified for treatment year. (b)Temporal trends regarding rates of in‐hospital mortality (solid black line), cardiopulmonary resuscitation (dashed black line), pneumonia (green line), stroke (yellow line) and acute kidney injury (blue line) stratified for treatment year. (c) Temporal trends regarding absolute numbers of PE patients with diabetes (yellow bars), proportion of PE patients with diabetes related to all PE patients (orange line) and proportion of PE patients with type 1 diabetes related to all PE patients (grey line) stratified for age decade. (d) Temporal trends regarding rates of in‐hospital mortality (solid black line), cardiopulmonary resuscitation (dashed black line), pneumonia (green line), stroke (yellow line) and acute kidney injury (blue line) stratified for age decade.
