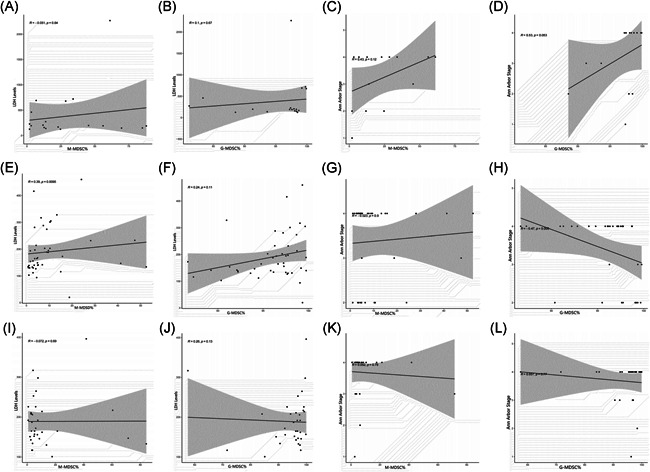
Figure 4.

The correlation analysis between MDSCs levels and LDH levels or Ann Arbor Stage in different status of B‐NHL patients. (A–D) No correlation was determined between MDSCs levels and LDH levels or Ann Arbor Stage in ND patients. (E, F) M‐MDSC% was positively correlated with the levels of LDH in remission patients of B‐NHL, while there existed no correlation between G‐MDSC% and LDH levels in remission patients. (G, H) No correlation was determined between MDSCs levels and Ann Arbor Stage in remission patients. (I–L) No correlation was determined between MDSCs levels and LDH levels or Ann Arbor Stage in relapsed patients. Each point represents an individual. The horizontal bar in correlation analysis represents the average. *p < .05, ns p ≥ .05. Each point represents an individual. The horizontal bar in correlation analysis represents the average. *p < .05, ns p ≥ .05. B‐NHL, B‐cell non‐Hodgkin lymphoma; G‐MDSCs, granulocytic‐myeloid‐derived suppressor cells; LDH, lactic dehydrogenase; M‐MDSCs, monocytic‐MDSC; ND, newly diagnosed
