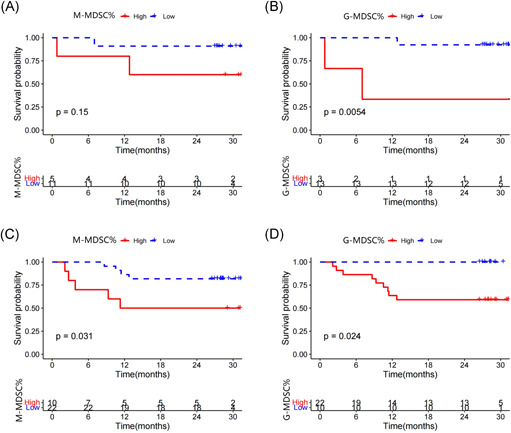
Figure 6.

Kaplan–Meier survival curve of overall survival (OS) according to the level of M‐MDSCs and G‐MDSCs. (A) Short OS was shown in high M‐MDSCs groups of B‐NHL ND patients. (B) Short OS was shown in high G‐MDSCs groups of B‐NHL ND patients. (C) Short OS was shown in high M‐MDSCs groups of B‐NHL relapsed patients. (D) Short OS was shown in high G‐MDSCs groups of B‐NHL relapsed patients. B‐NHL, B‐cell non‐Hodgkin lymphoma; G‐MDSCs, granulocytic‐myeloid‐derived suppressor cells; M‐MDSCs, monocytic‐MDSC; ND, newly diagnosed
