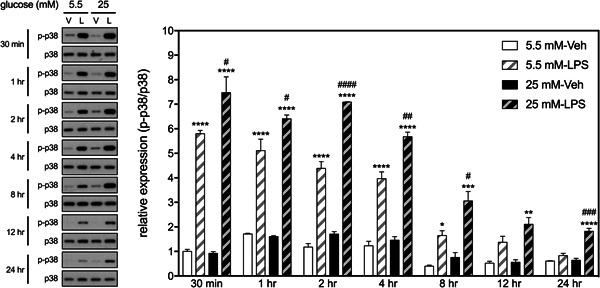
Figure 3.

Effects of HGM and LPS on phosphorylation of p38 in BV2 microglial cells. Representative micrographs and corresponding quantitative results for Western blots. LPS, 500 ng/ml. Data are expressed as mean ± standard deviation. HGM, high glucose medium; LPS, lipopolysaccharide. *p < .05, **p < .01, ***p < .001, ****p < .0001, versus respective Veh group at the same time point, Tukey's multiple comparison test. #p < .05, ##p < .01, ###p < .001, ####p < .0001, versus respective 5.5 mM group at the same time point, Tukey's multiple comparison test. n = 3
