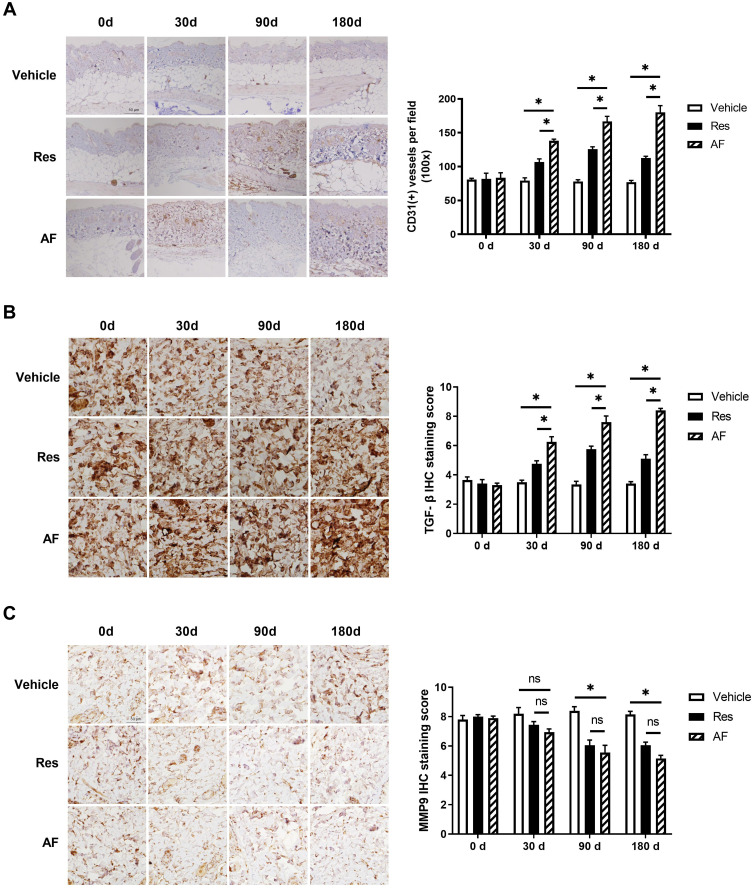
Figure 2.
Age-matched BALB/c mice (n=6) treated with vehicle, Res and AF injection. Skin biopsies were taken at the injection sites of the three groups on day 0, 30, 90 and 180 after injection. Immunohistochemical (IHC) staining were performed to evaluate the protein levels. (A) Representative images of CD31 (left) and the statistical analysis of its expression levels (right) at progressive time points, bar = 50 µm (* = P < 0.05). (B) Representative images of TGF-β (left) and the statistical analysis of its expression levels (right) at progressive time points, bar = 50 µm (* = P < 0.05). (C) Representative images of MMP (left) and the statistical analysis of its expression levels (right) at progressive time points, bar = 50 µm (* = P < 0.05). Results are shown as means ± SEM.

