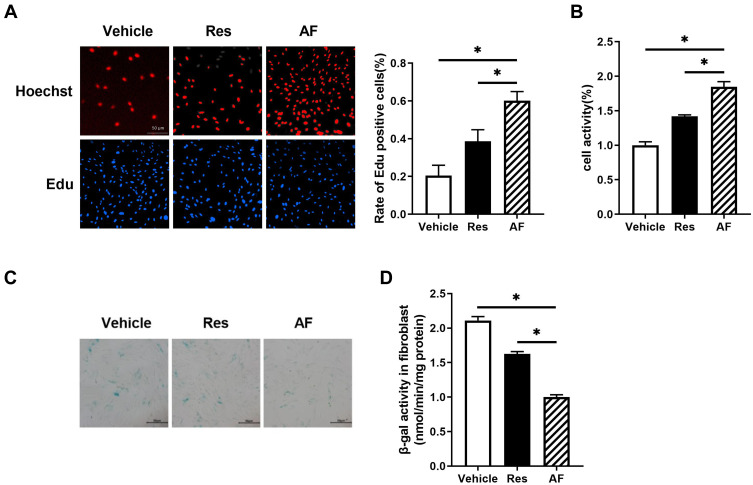
Figure 3.
Primary fibroblasts were treated with the vehicle, AF and Res for 1 month. (A) The EdU incorporation assays were performed to determine the proliferation. Representative images (left) and the statistical analysis (right) for the rate of the Edu positive cells in different groups, bar = 50 µm (* = P < 0.05). (B) CCK-8 assay was used to detect the viability of fibroblast in different groups. (* = P < 0.05). (C) Representative images of SA-β-gal staining in different groups, bar = 50 µm. (D) SA-β-gal activity was measured by using activity assay kit in different groups (* = P < 0.05). Results are shown as means ± SEM.

