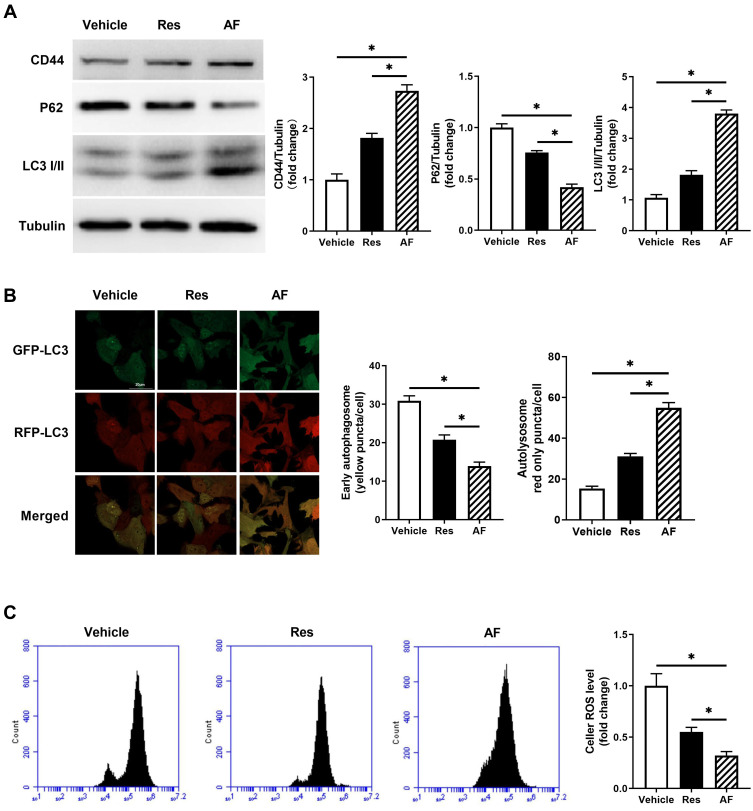
Figure 4.
Primary fibroblasts were treated with the vehicle, AF and Res for 1 month. (A) Representative of CD44, P62 and LC3I/II immunoblotting in primary fibroblasts treated with the vehicle, AF and Res groups (left), and the quantified data (right) (* = P < 0.05). (B) LC3-GFP-RFP adeno virus was used to measure the autophagy flux. Representative confocal images of primary fibroblasts treated with the vehicle, AF and Res. Yellow showed co-localization of GFP and RFP, indicating early autophagosomes. Red only showed autolysosomes, bar = 20 µm (* = P < 0.05). (C) ROS level of fibroblast in the vehicle, AF and Res groups was detected by flow cytometry with DCFH-DA, a ROS molecular detector. (* = P < 0.05). Results are shown as means ± SEM.

