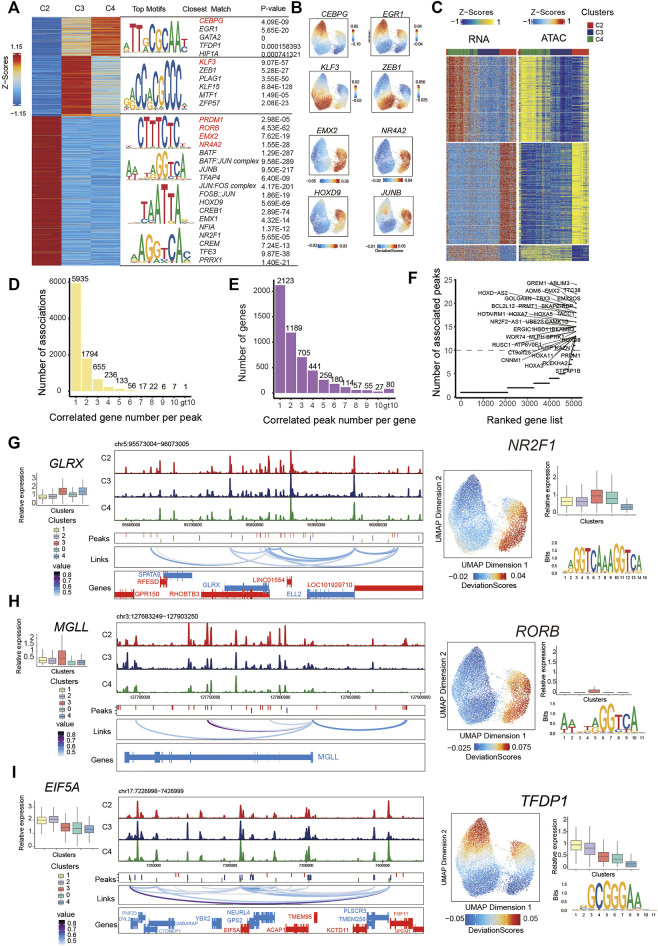
FIGURE 3.
Integrated analysis of cell state–specific epigenetic regulators in inferred PMSC subgroups.(A) Heat map representing PMSC cell states marker peaks. Each row represents an individual marker peak, colored by the normalized marker peak accessibility score (Z-score) (Left). Transcription factor motifs and transcription factor and P-value enriched in each cell state marker peak sequence. Transcription factor motifs selected in red. (B) The same UMAP visualization shown in Figure 2A, but each cell is colored by the enrichment of TF activity score (deviations) calculated in ArchR using ChromVAR. (C) Heat maps of 13,863 significant peak-to-gene links across cell states (FDR<0.0001; corCutOff > 0.4; varCutOff > 025 when selecting links by plotPeak2GeneHeatmap function). Top, peak-to-gene links that are identified almost within C4. Middle, peak-to-gene links that are unique to C2. Bottom, peak-to-gene links identified in both C3 and C4. (D) The number of significant peak–gene links for all peaks. (E) The number of significant peak–gene links for all genes. (F) The number of significantly correlated peaks for each gene. Putative DORCs are highlighted. (G-I) Aggregated scATAC-seq tracks showing genomic regions near GLRX(G), MGLL (H), and EIF5A (I) genes. Different peaks in clusters are shown in the second line. The loop in the third line height represents the significance of peak-to-gene links (corCutOff = 0.45, FDRCutOff = 1e-04, varCutOffATAC = 0.25, varCutOffRNA = 0.25). The RNA expressions are present on the left boxplot. The motif enrichment for associated peaks (shown in (C)) are shown in the right and the UMAP show the enrichment of TF activity score (deviations); the boxplot shows the RNA expression of the enriched TF.

