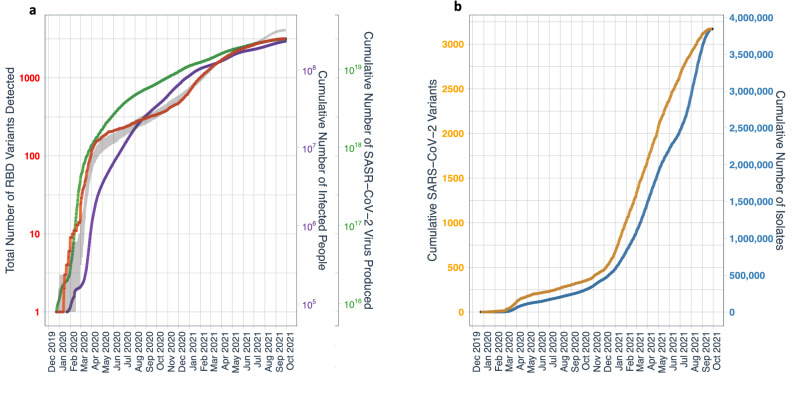
Figure 1.
(a) Cumulative number of SARS-CoV-2-infected humans (purple line), calculated total number of virus copies produced (green line) until October 5, 2021 (cf. “Methods”), detected (red line) and predicted (grey shaded area, representing minimum and maximum bounds) RBD variants over time. The predicted RBD variants are based on Monte Carlo simulation of viral mutations. New RBD variants are generated based on a mutation rate of 2 per million human infections. The fitness of new variants is taken as a Pareto distribution with scale 10–6 and shape parameter ¼. The proportional population of two variants is assumed to change at a rate proportional to the ratio of their fitness, with a characteristic time of 20 days. Isolates are modeled as random samples from the resulting viral population. (b) Cumulative number of SARS-CoV-2 isolates sequenced over time (blue line) and cumulative number of detected RBD variants rescaled by a factor of 900 over time (brown line).

