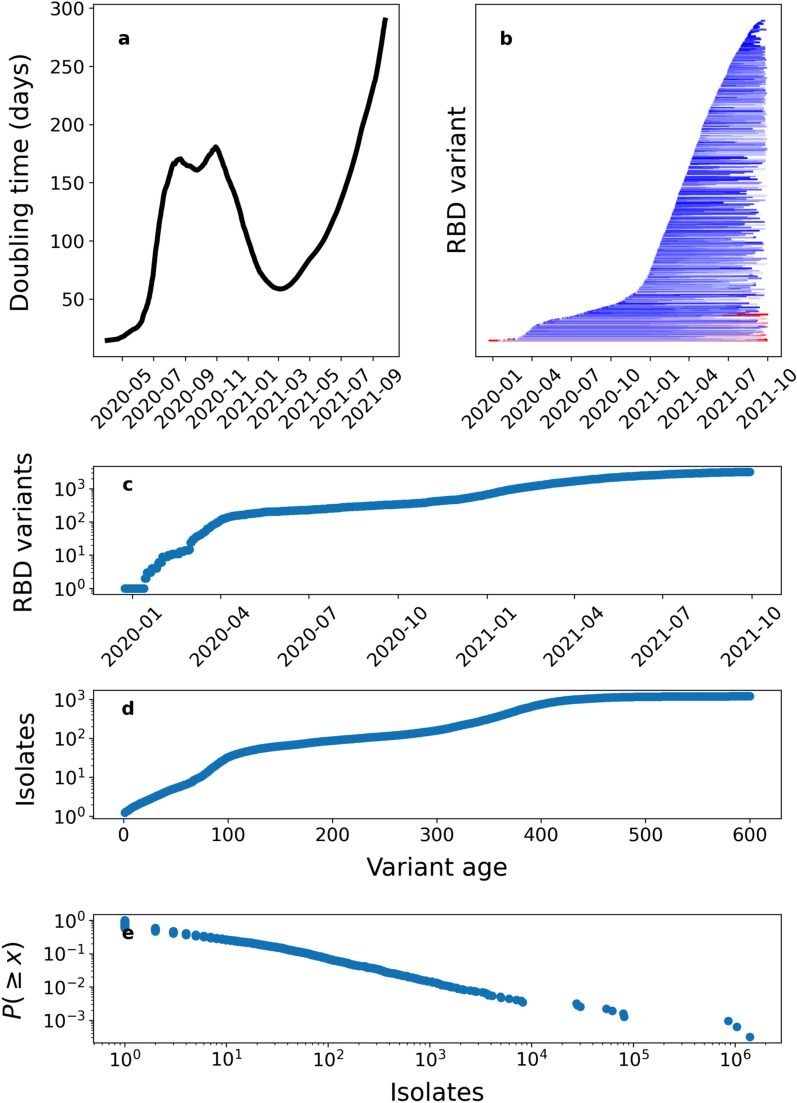
Figure 2.
(a) Doubling time for RBD variants calculated along a 100 day rolling window. (b) Rank abundance distribution of RBD variants, and (c) the growth in the number of genome sequences of different unique RBD variants detected from SARS-CoV-2 isolates over time. The figure (b) shows a line for each RBD variant along the y-axis that spans from the first day it was observed to the last date it was observed. The color scale denotes the final number of isolates of each RBD variant (increasing from blue to red). Yule’s model of the growth of RBD variants and isolates for each variant, showing the total number of detected unique RBD variants (c) and their age (as time since first detection) (d) over time, resulting in a power law rank abundance distribution (e). Numerically, the characteristic exponent of the exponential growth for RBD variants is 0.00439 ± 0.00004 day−1 (SD); then for the average growth it yields 0.00589 ± 0.00004 day−1 (SD); leading to an expected exponent of the rank abundance distribution (e) of 1.34 (to be compared with 1.45 from the data).

