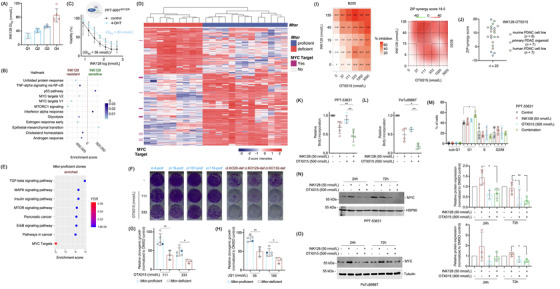
FIGURE 1.

MYC confers mTORi resistance. (A) Heterogeneity in responsiveness to mTORi. Twenty murine PDAC cell lines were treated with a seven‐point dilution of the mTORi INK128 (1000, 500, 100, 50, 10, 5, 1 nmol/L) and analyzed by Thiazolyl Blue Tetrazolium Bromide (MTT) assay after 72 hours. Half‐maximal growth inhibitory concentration (GI50) values were determined and separated into quartiles. (B) MYC and mTOR signatures are enriched in mTORi resistant cells. RNA‐seq data from the most sensitive cells from A (Q1) were compared to the more resistant cells (Q2, Q3 and Q4) by gene set enrichment analysis (GSEA) using the GeneTrail 3.0 platform. The enrichment score and the q values are depicted. (C) Conditional activation of MYC renders cells resistant to mTORi. The murine PPT‐9091MYCER cell line, which has been transduced with a MYCER fusion protein was used. Cells were treated with INK‐128 in the presence or absence of 4‐Hydroxytamoxifen (600 nmol/L) for 72 hours as indicated. Afterward, MTT viability assays were performed. Experiments were performed in n = 3 independent biological experiments and the GI50 values were depicted. (D) Heatmap displaying a hierarchical cluster with the intensities of phosphopeptides (rows) showing statistically significant abundance (two‐sample t‐test, FDR < 0.05, S0 = 1) between Mtor‐proficient and ‐deficient clonal cell lines. Columns display the biological replicates for the individual clones and rows the phosphopeptides intensities (z‐scored, imputed). Phosphopeptides from MYC target proteins (GSEA HALLMARK MYC TARGETS) are indicated in dark pink on the left side. (E) Enriched KEGG pathways in Mtor‐proficient clones, enrichment factor and P value from a Fisher's exact test corrected according to Benjamini‐Hochberg (FDR) performed with each cluster compared to the total phosphoproteome. In addition, the GSEA HALLMARK MYC TARGETS signature is depicted. (F‐H) Reduced clonogenic growth in Mtor‐deficient clones upon BETi treatment. 2,000 cells per well of the Mtor‐proficient clones (n = 4) and the parental cell line PPT4‐ZH363‐Mtor∆E3/lox or 3,000 cells per well of the Mtor‐deficient clones (n = 3) were seeded in 12‐well plates and treated in duplicates with (F) OTX015 (111 and 333 nmol/L) on the following day. Dimethyl sulfoxide (DMSO) was used as vehicle control. (G) Quantification of F. (H) Clonogenic assay as described in (F) was performed using JQ1 (55 and 165 nmol/L). The quantification is depicted. (G) and (H) Unpaired t‐test: *P < 0.05, **P < 0.01. The blue dot marks the parental cell line. (I) Human PDAC organoids (n = 7) were treated with a combination matrix with 4 dilutions of the mTORi INK128 (5, 15, 45, 135 nmol/L) and 5 dilutions of the BETi OTX015 (37, 111, 333, 1000, 3000 nmol/L). After 72 hours viability was measured using CellTiter‐Glo assays. The % inhibition for each combination is shown on the left‐sided panel and the calculated overall ZIP score on the right‐sided panel. (J) Synergistic mode of action between INK‐128 and OTX015 in a subset of murine and human PDAC cells. Overview of ZIP scores for the combination of INK128 with OTX015 in a panel of conventional human PDAC cell lines (n = 7) (data based on MTT), murine PDAC cell lines (n = 8) (data based on clonogenic growth assays) and human PDAC organoids (n = 7) (data based on CellTiter‐ Glo assays). (K) and (L) BrdU Incorporation is reduced upon combination of mTORi and BETi. The murine PDAC cell line PPT‐53631 (K) and the human PDAC cell line PaTu8988T (L) were seeded out in white 96‐well plates and treated in triplicates on the following day with 50 nmol/L INK128, 500 nmol/L OTX015 or the combination thereof. BrdU (10 μmol/L) was added after 24 hours for an additional 2 hours. BrdU incorporation was assessed by a chemiluminescent BrdU Cell Proliferation ELISA Kit and luminescence values were normalized to untreated controls (n = 4–5). One‐way ANOVA with correction for multiple testing according to Tukey: *P < 0.05, **P < 0.01. (M) Combination of mTORi and BETi induces G1 growth arrest. The cell cycle profile of PPT‐53631 after 24 hours treatment with 50 nmol/L INK‐128, 500 nmol/L OTX015 or the combination of the two was determined by 7AAD‐BrdU flow cytometric analysis. Shown is the fraction of cells in sub‐G1, G1, S and G2/M phases of the cell cycle (n = 4). One‐way ANOVA with correction for multiple testing according to Tukey: *P < 0.05. (N) Representative Western Blot and quantification showing MYC protein expression is reduced upon combined treatment with INK‐128 and OTX015 in PPT‐53631. The MYC protein expression in the murine PDAC cell line PPT‐53631 after treatment with 50 nmol/L INK‐128, 500 nmol/L OTX015 or the combination thereof for 24 and 72 hours was determined by immunoblot. MYC protein expression was normalized to loading control and is depicted as relative protein expression normalized to DMSO treated controls. One‐way ANOVA with correction for multiple testing according to Tukey: *P < 0.05, **P < 0.01. (O) Representative Western Blot and quantification showing MYC protein expression is reduced upon combined treatment with INK‐128 and OTX015 in PaTu8988T. The MYC protein expression in the human PDAC cell line PaTuT8988T after treatment with 50 nmol/L INK128, 500 nmol/L OTX015 or the combination thereof for 24 and 72 hours was determined by immunoblot. MYC protein expression was normalized to loading control and is depicted as relative protein expression normalized to DMSO treated controls. One‐way ANOVA with correction for multiple testing according to Tukey: *P < 0.05. Abbreviations: 24h: 24 hours, 72h: 72 hours, ANOVA: analysis of variance, BET: bromodomain and extra‐terminal motif, BETi: BET inhibitor, BrdU: 5‐bromo‐2'‐deoxyuridine, cl: clone, def: (Mtor) deficient, DMSO: dimethyl sulfoxide, ELISA: enzyme‐linked immunosorbent assay, FDR: False Discovery Rate, GI50: Half‐maximal growth inhibitory concentration, GSEA: gene set enrichment analysis, h: hours, KEGG: Kyoto Encyclopedia of Genes and Genomes, mTOR: mechanistic Target of Rapamycin, mTORi: mTOR inhibitor, MTT: Thiazolyl Blue Tetrazolium Bromide, MYC: myelocytomatosis oncogene, MYCER: MYC–estrogen receptor (ER) fusion gene, PDAC: pancreatic ductal adenocarcinoma, prof: Mtor‐proficient, def: Mtor‐deficient, q: q value, RNA: ribonucleic acid, RNA‐seq: RNA‐sequencing, ZIP: zero‐interaction potency
