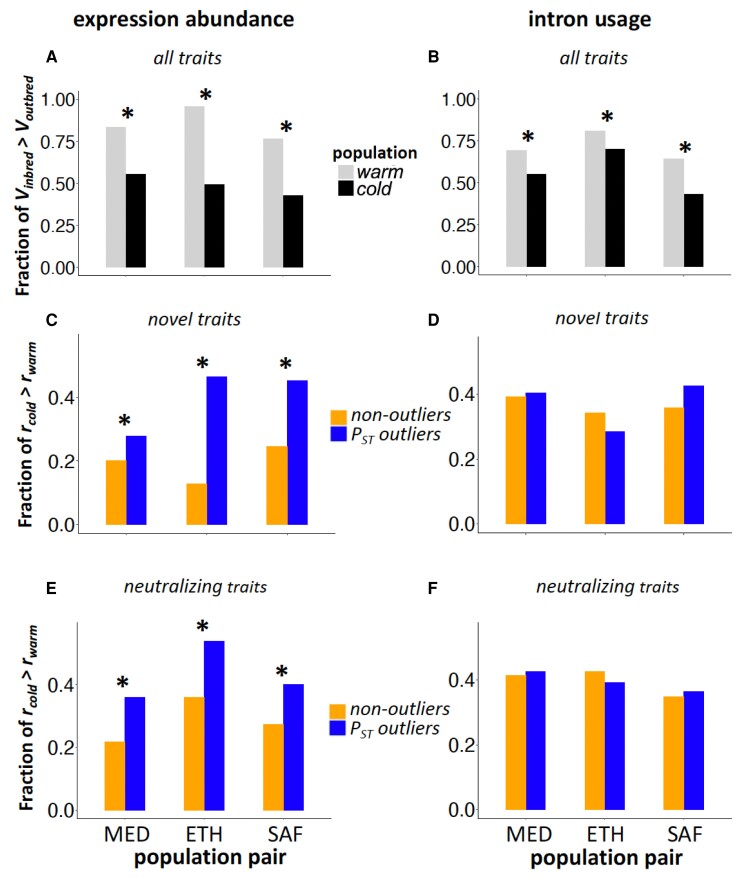
Fig. 4.
Genetic decanalization measured by Vinbred relative to Voutbred (r). (A and B) Transcriptome-wide fraction of regulatory traits for which r > 1 for each warm-adapted and cold-adapted population is shown for expression abundance (A) and intron usage (B). (C–F) Fraction of traits with novel regulatory changes (C and D) or with neutralizing changes (E and F) for which rcold > rwarm for PST outliers and nonoutlier controls is shown for expression abundance (left) and intron usage (right). *Fractions are significantly different (all with P < 0.05).

