
Figure 5.
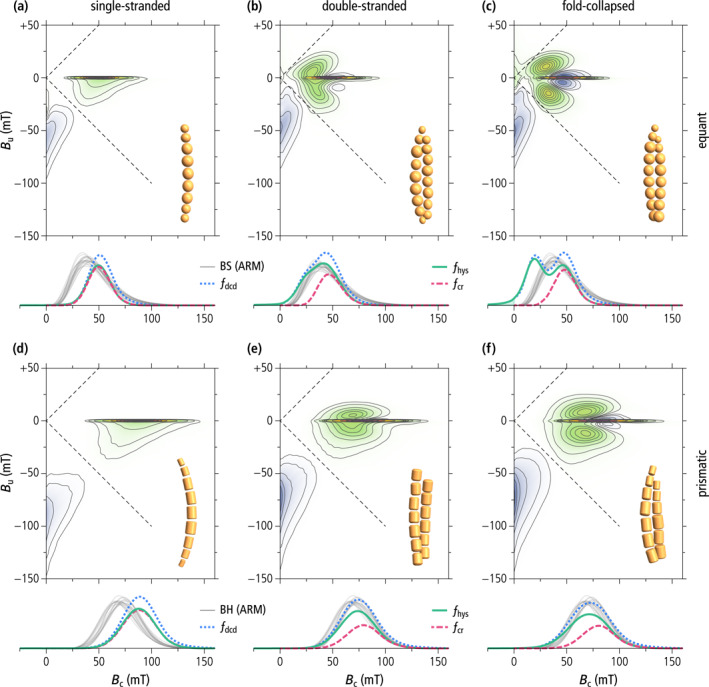
Micromagnetically simulated FORC diagrams of single‐stranded chains (left), native double‐stranded chains (middle) and fold‐collapsed chains (right) of equidimensional (top) and prismatic (bottom) magnetite magnetosomes. Each FORC diagram corresponds to ∼105 randomly oriented chains with a realistic distribution of geometric parameters as explained in the text. Coercivity distributions obtained from the simulated FORC data (f dcd—DC demagnetization of saturation remanence, f hys—irreversible component of the ascending hysteresis branch, f cr—central ridge) are shown below, together with coercivity distributions of the biogenic component BS (gray lines in (a–c)) and BH (gray lines in (d–f)), obtained from AF demagnetization curves of ARM (from Egli, 2004a). All FORC diagrams share the same color scale (blue—negative values, green to violet—positive values) with q = 5%, 10%, 20%, 30%, 40%, 50%, 60%, 70%, 80%, and 90% quantile contours. The FORC region enclosed by the q‐quantile contour contributes to a fraction 1 – q of the total FORC integral (Egli, 2021). Dashed lines indicate the left boundary of the so‐called memory region of the FORC space.