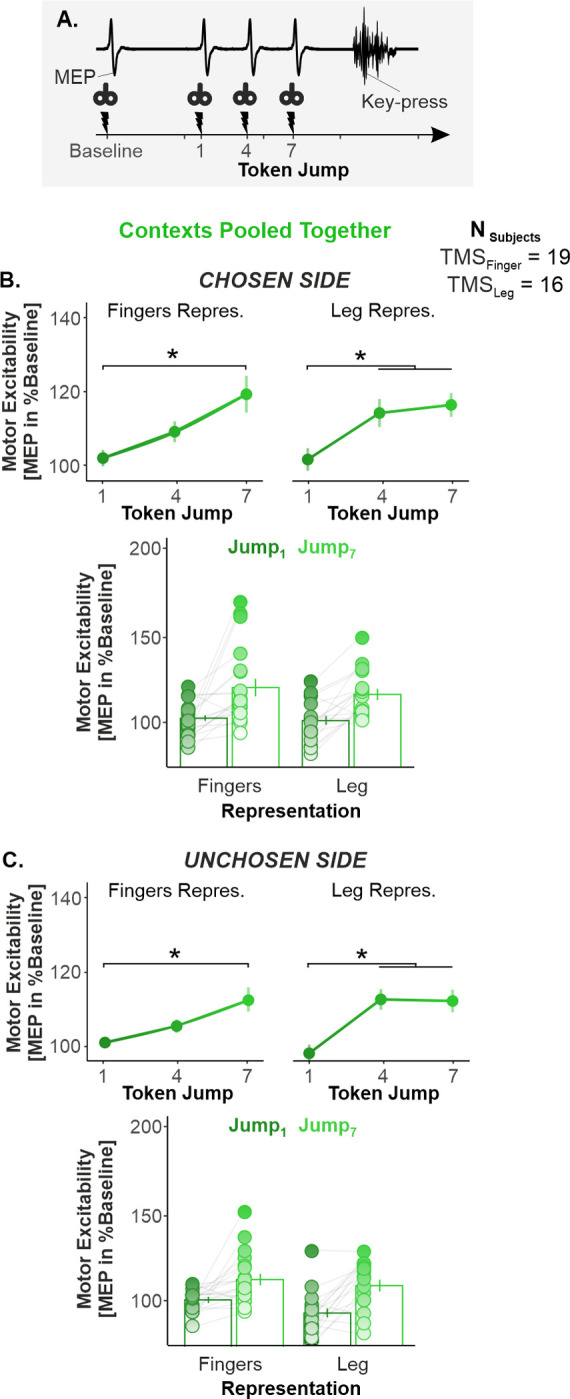
Fig 3. Motor excitability globally increased as time elapsed during deliberation.

(A) TMS timings. We applied TMS at 4 timings during the task: at baseline (i.e., between the trials) and at Jump1, Jump4, and Jump7 during the decision period. (B) Main effect of TIMING on motor excitability on the chosen side. To highlight the main effect of TIMING, both SAT contexts were pooled together. Further, the data obtained for the index, the thumb, and the pinky representations (top left) were averaged for the figure as well as the data obtained for the 3 leg representations (top right). The bar graph at the bottom displays the individual data points, as obtained at Jump1 (dark green) versus Jump7 (light green). Overall, this representation shows that a large proportion of participants exhibited an increase in motor excitability from Jump1 to Jump7, both in the finger and in the leg representations. (C) Same as B. for the unchosen side. Error bars represent 1 SEM. * significant effect of timing at p < 0.05. All individual and group-averaged numerical data exploited for Fig 3 are freely available at this link: https://osf.io/tbw7h. SAT, speed–accuracy trade-off; TMS, transcranial magnetic stimulation.
