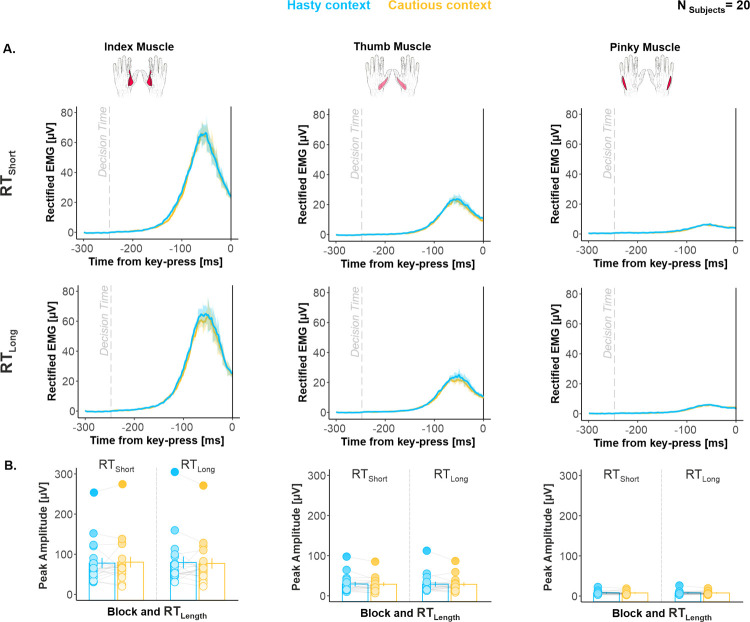
Fig 7. (related to S8 Fig).
Movement vigor was unaffected by elapsed time and hastiness. (A) Group-averaged rectified EMG activity. Shaded error bars represent 1 SEM. The vertical dotted line indicates the estimated DT (see Materials and methods). (B) Group-averaged peak amplitude. Error bars represent 1 SEM. Overall, EMG activity was comparable for RTShort and RTLong as well as across contexts in each of the 3 muscles. All individual and group-averaged numerical data exploited for Fig 7 are freely available at this link: https://osf.io/tbw7h. DT, decision time; EMG, electromyography; RT, reaction time.

