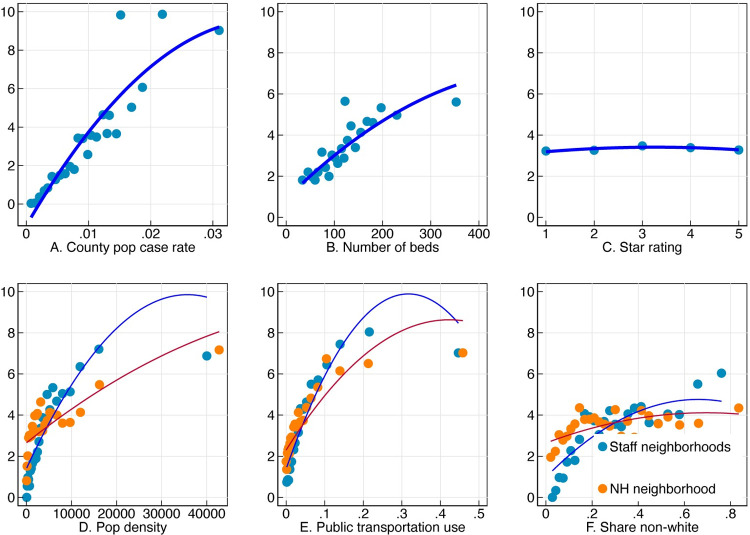
Fig 2. Relationship of facility deaths per bed with staff and nursing home neighborhood characteristics, facility size, and star rating.
Each panel of the figure shows average nursing home deaths per 100 beds on the y-axis binned by a different variable along the x-axis. Bins are of equal sizes, and the line represents a quadratic fit.

