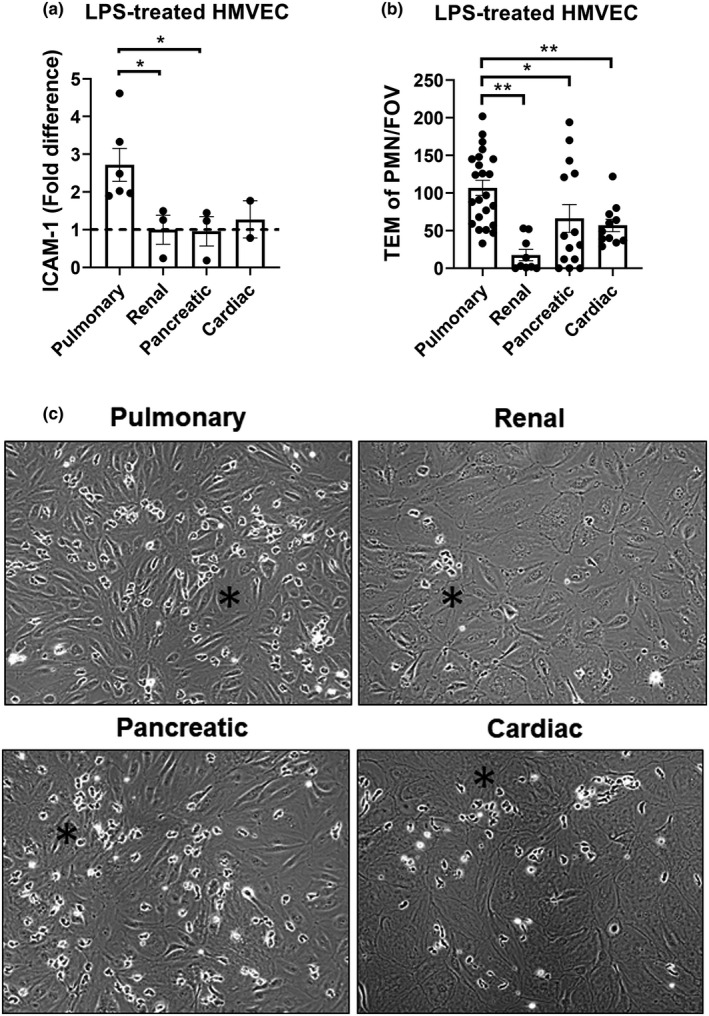
FIGURE 2.

Pulmonary HMVECs show increased ICAM‐1 expression and efficiently facilitate LPS‐induced neutrophil TEM compared to other types of HMVECs. (a) Quantification of FACS data for ICAM‐1 at treatment with 10 ng/mL LPS. Renal HMVEC data points were divided by their own average to indicate variance. All other data points were divided by renal HMVEC data points to acquire fold difference. All cells had been selected for PECAM‐1 and VE‐cadherin double‐positivity. *p < 0.05, error bars are presented as standard error of mean (SEM), n = 3 except HCEC n = 2. (b) Number of transmigrated neutrophils during flow TEM assay in all organ microvascular ECs as indicated after 5 h treatment with 10 ng/mL LPS. Data points represent PMN‐TEM per field of view (FOV). Three fields of view per channel were obtained during time‐lapse imaging, followed by tile scans with 25 additional fields of view per condition and replicate at the endpoint to determine the distribution of neutrophils. Bars represent average TEM of PMN/FOV for all experiments. *p < 0.05, **p < 0.01, error bars are presented as standard error of mean (SEM), n = 3–6. (c) Representative images from TEM assay. Black star indicates an area with a small cluster of transmigrated PMNs
