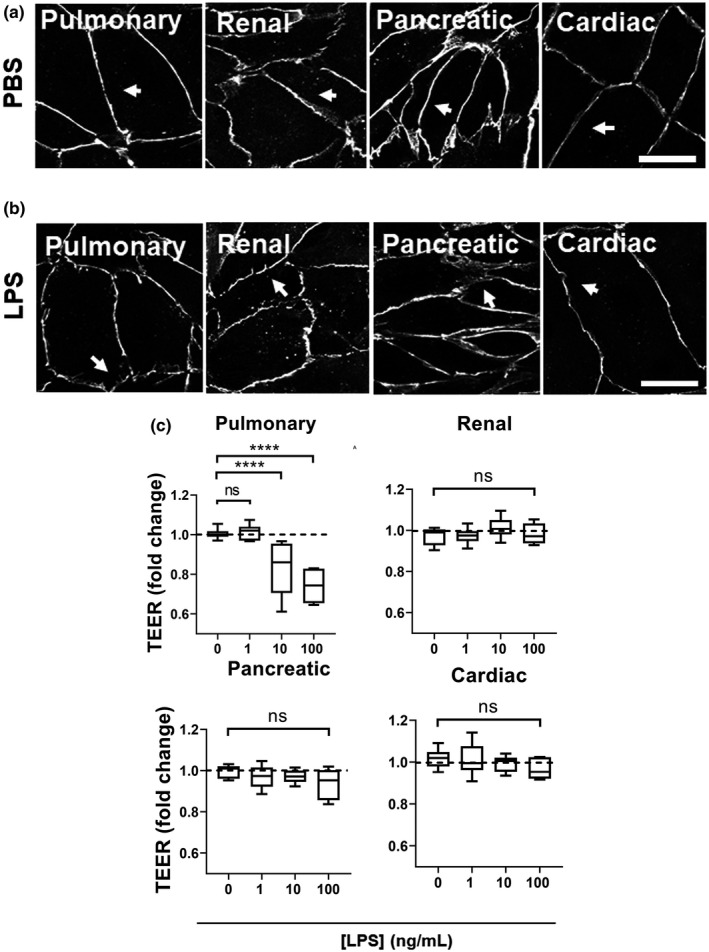
FIGURE 3.

Resistance of endothelial cell‐cell junctions is dose‐dependently reduced by LPS in pulmonary HMVECs but not in other types of HMVECs. (a) Immunofluorescent images of ECs as indicated treated with PBS (CTRL) and stained for VE‐cadherin (white). Bar represents 20 µm. White arrows indicate linear junctions. (b) Immunofluorescent images of ECs as indicated treated with 10 ng/mL of LPS and stained for VE‐cadherin (white). Bar represents 20 µm. White arrows indicate jagged junctions between two cells. (c) Box‐plots of endothelial resistance indicating min to max values and average of all data points for all ECs as indicated. All data points were normalized to their own stabile resistance pre‐treatment with PBS or LPS. Dashed line indicates 1. TEER = Trans‐Endothelial Electrical Resistance. ****p < 0.0001, ns = non‐significant, n = 3–6
