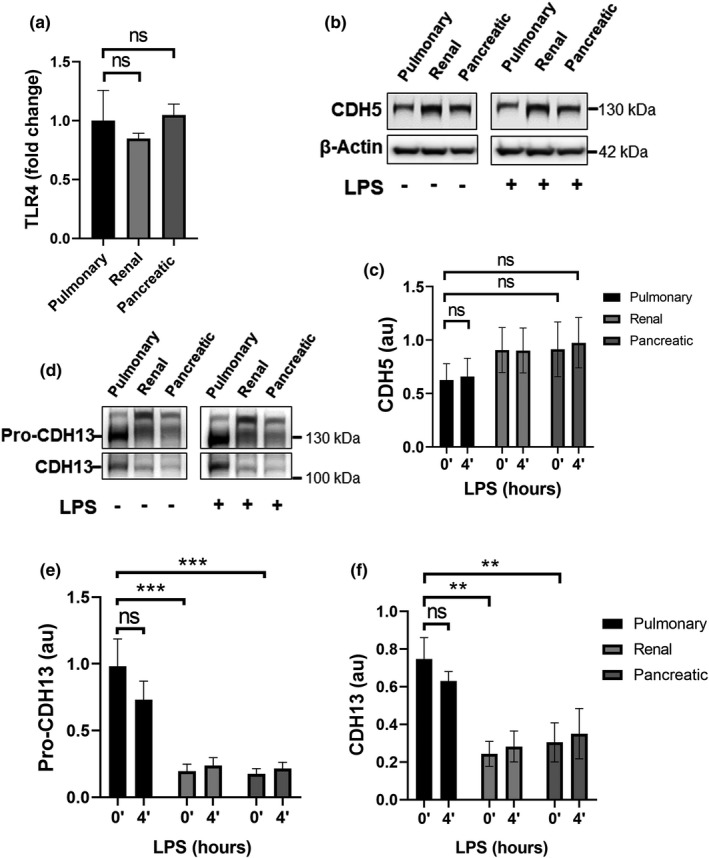
FIGURE 4.

Pulmonary HMVECs do not display increased TLR4 surface expression compared to other types of HMVECs, but do display increased expression of CDH13. (a) Quantification of FACS data for TLR4 in untreated ECs as indicated. pulmonary HMVECs data points were divided by own average to indicate variance. All other data points were divided by pulmonary HMVECs data points to acquire fold the difference. All cells had been selected for PECAM‐1 and VE‐cadherin double‐positivity, ns, non‐significant, error bars are presented as the standard error of mean (SEM), n = 3. (b) Western blot of whole cell lysates from ECs as indicated treated with PBS (CTRL) or LPS and blotted for VE‐cadherin (CDH5) and β‐actin, as a loading control. (c) Quantification of Western blots presented in Figure 5(b). CDH5 units derived from ImageJ were divided by units for β‐actin. AU = arbitrary units, ns = non‐significant, error bars are presented as standard error of mean (SEM), n = 5. (d) Western blot analysis of whole cell lysates of ECs as indicated treated with PBS (CTRL) (0’) or LPS (4’) and incubated with antibodies against CDH13. CDH13 blot is the same as CDH5 in Figure 4b but developed on film with ECL. β‐actin blot is depicted in Figure 4(b). Images were analyzed with ImageJ. (e) Quantification of Western blots presented in Figure 4d. CDH13 units derived from ImageJ were divided by units for β‐actin. AU = arbitrary units, ns = non‐significant, **p < 0.01, ***p < 0.001, error bars are presented as standard error of mean (SEM), n = 5
