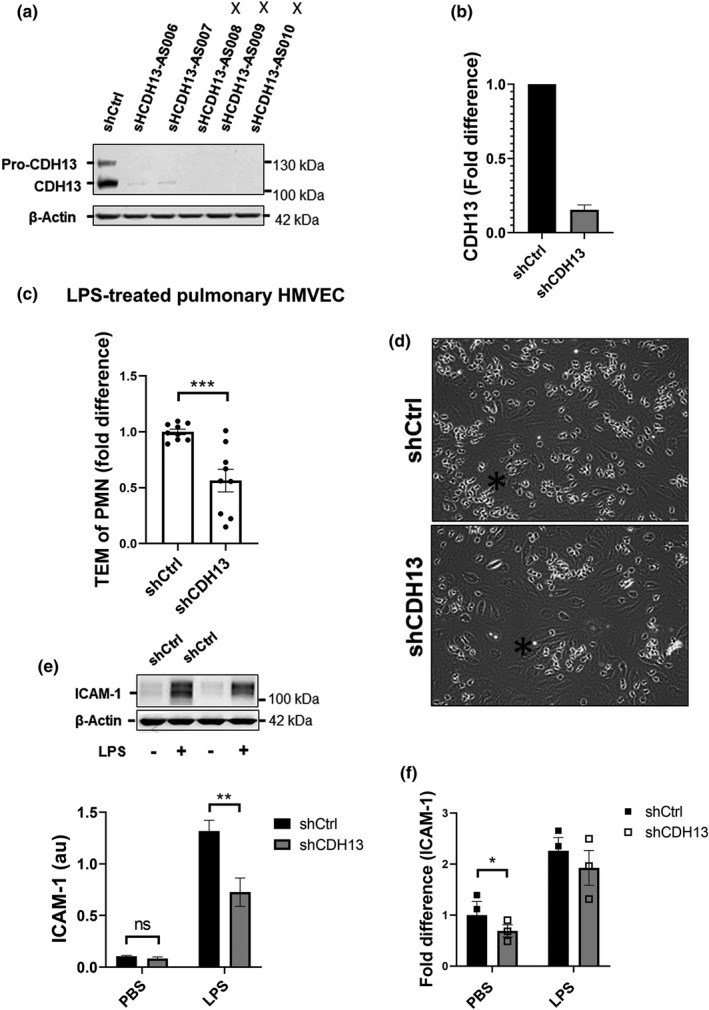
FIGURE 5.

CDH13 aids neutrophil‐TEM in pulmonary HMVECs (a) Western blot analysis of whole cell lysates from pulmonary HMVECs after 96h from lentiviral transduction with short‐hairpin control (shCtrl) or short‐hairpin CDH13 (shCDH13) and incubated with antibodies against CDH13 and β‐actin. Images were developed on film using ECL. Images were analyzed with ImageJ. X marks the three constructs used for experiments. (b) Quantification of Western blot exampled in Figure 5a. shCtrl and shCDH13 units derived from ImageJ were divided by units for β‐actin to generate arbitrary units. All shCDH13 samples were divided by shCtrl which was set to 1 to indicate knock‐down efficiency. Error bar is presented as standard error of mean (SEM), n = 3 (c) Number of transmigrated neutrophils during flow TEM assay in pulmonary ECs after 5 h treatment with 10 ng/mL LPS. Data points represent PMN‐TEM per field of view (FOV). Three fields of view per channel were obtained during time‐lapse imaging, followed by tile scans with 25 additional fields of view per condition and replicate at the endpoint to determine the distribution of neutrophils. Bars represent average TEM of PMN/FOV for all experiments. ***p < 0.001, error bars are presented as standard error of mean (SEM), n = 3. (d) Representative images from TEM assay. Black star indicates an area with a small cluster of transmigrated PMNs. (e) Western blot analysis and quantification of whole cell lysates from pulmonary HMVECs after 96 h lentiviral transduction with short‐hairpin control (shCtrl) or short‐hairpin CDH13 (shCDH13), PBS or LPS stimulation for 20 h and incubated with antibodies against ICAM‐1 and β‐actin. Images were developed on film using ECL. Images were analyzed with ImageJ. ICAM‐1 units derived from ImageJ were divided by units for β‐actin to generate arbitrary units. AU = arbitrary units, ns = non‐significant, **p < 0.01, error bars are presented as standard error of mean (SEM), n = 3. (f) Flow cytometry data for ICAM‐1 in pulmonary ECs treated as indicated. PBS‐treated sh‐Ctrl pulmonary HMVECs data points were divided by their own average to indicate variance. All other data points were divided by PBS‐treated sh‐Ctrl pulmonary HMVECs data points to acquire fold difference. All cells had been selected for PECAM‐1 and VE‐cadherin double‐positivity, ns = non‐significant, error bars are presented as standard error of mean (SEM), n = 3
