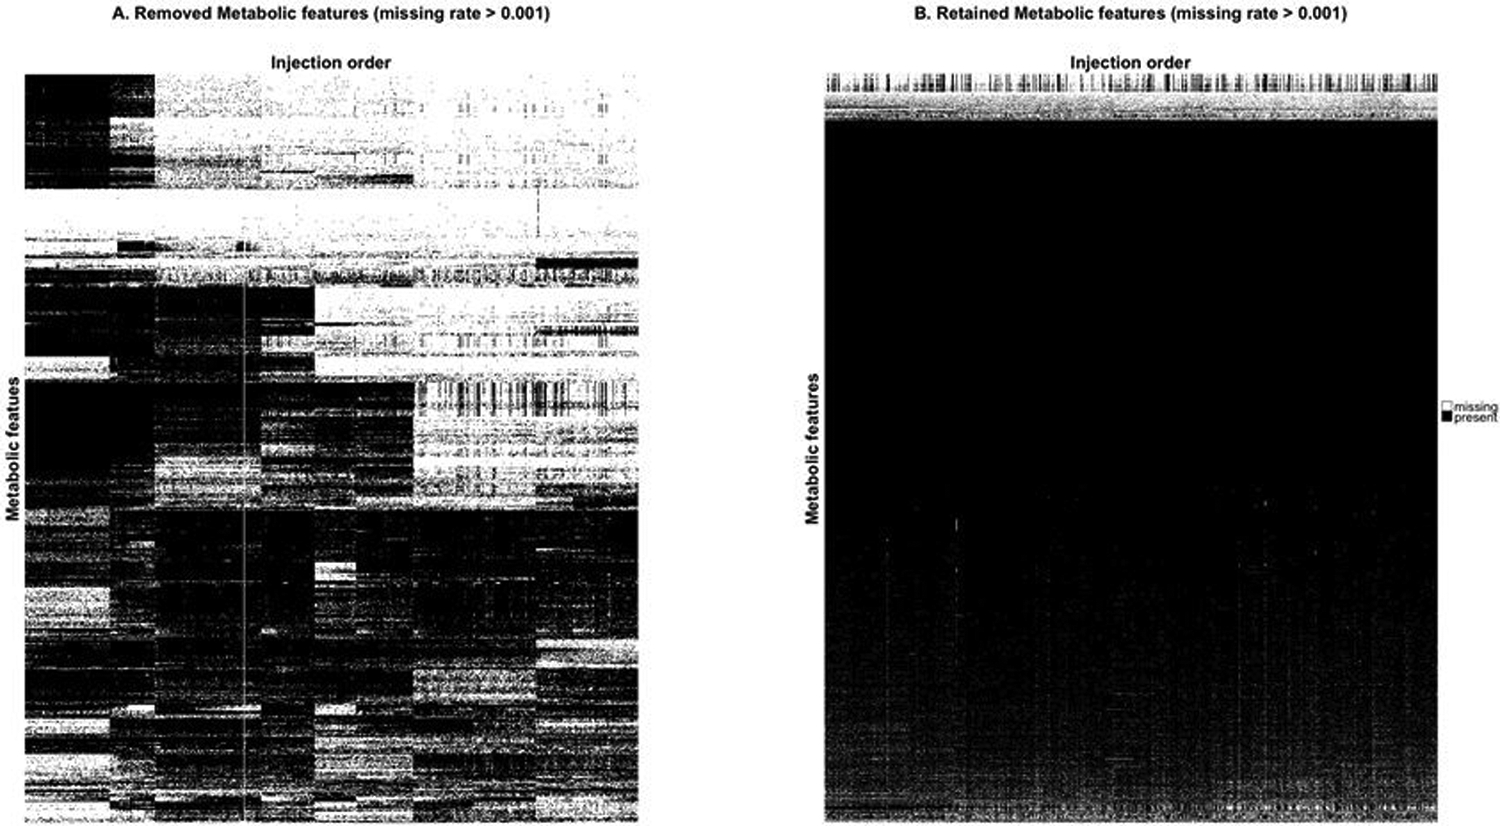
Figure 3.

Missing data patterns of metabolites across injection order are visualized in (a) the removed metabolites and (b) the retained metabolites using lipid data from the PREDIMED study. Each row represents a metabolite and each column is a sample, sorted by injection order. Black marks represent present data and white marks represent missing data. Metabolites are clustered using hierarchical clustering to better illustrate block structure. In both cases only metabolic features with overall missing rates greater than 0.001 are included to avoid plotting metabolic features with completely present data.
