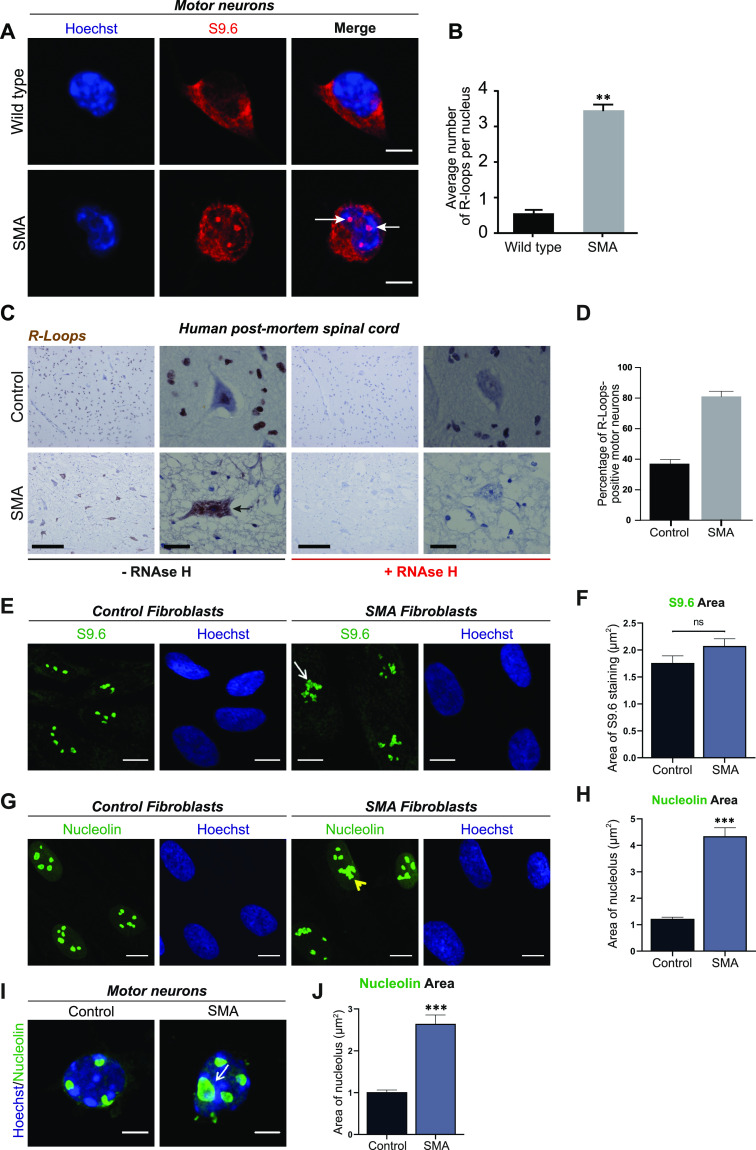
Figure 1. Accumulation of R loops in survival motor neuron (SMN)–deficient cells and ribosomal disruption.
(A) p75-enriched motor neurons derived from SMNΔ7 and wild type E13 embryos were labelled with RNA/DNA heteroduplex-specific antibody, S9.6 (Kerafast, ENH001) at DIV7. Scale bars represent 5 μm. (B) Quantification of the number of RNA/DNA hybrids (R-Loops) in spinal muscular atrophy (SMA) and wild type motor neurons. Data presented as mean ± SEM **P < 0.01; paired two-tailed t test (P = 0.0016). The data were collected from three biological independent replicates (N = 3). Nuclei counted = 10/replicate. (C) Sections of postmortem spinal cord from SMA patients (N = 4) and control individuals (N = 2) were stained for S9.6. Specificity of S9.6 staining confirmed by treating sections with RNAse H enzyme before R-loop labelling. Scale bars represent 50 μm (left images) and 10 μm (right images), respectively. (D) Percentage of R-Loop–positive motor neurons in spinal cord sections from SMA patients and control individuals. P-value analysis was not performed as only two controls were analysed because of the difficulty in having postmortem tissue from healthy young children. (E) Fibroblasts derived from SMA type I child (GM08318) and healthy control (GM00498) were labelled for RNA/DNA hybrids (S9.6). Scale bars represent 10 μm. Arrow indicates an abnormal structure. (F) Total area of staining per cell (µm2), determined by boundaries of S9.6 immunofluorescence was measured for control and SMA fibroblasts. Bar graphs of mean ± SEM (N = 3). Mann–Whitney non-parametric test. ns, not significant (P > 0.05). (G) Fibroblasts derived from SMA type I child and healthy control were stained with nucleolin (green). Yellow arrowhead shows disrupted nucleoli. Scale bars represent 10 μm. (H) Total nucleolar area per cell (µm2) determined by boundaries of nucleolin immunofluorescence was measured for Control and SMA fibroblasts. Bar graphs of mean ± SEM (N = 3). Mann–Whitney non-parametric test. ***P ≤ 0.001. (I) E13 motor neurons derived from SMA and wild type mouse embryos were also stained with nucleolin (green) antibody and Hoechst (blue). White arrow shows an enlarged (disrupted) nucleolus. Scale bars represent 5 μm. (J) Total nucleolar area per cell (µm2) was measured and data presented as mean ± SEM (N = 3). Mann–Whitney non-parametric test. ***P ≤ 0.001.

