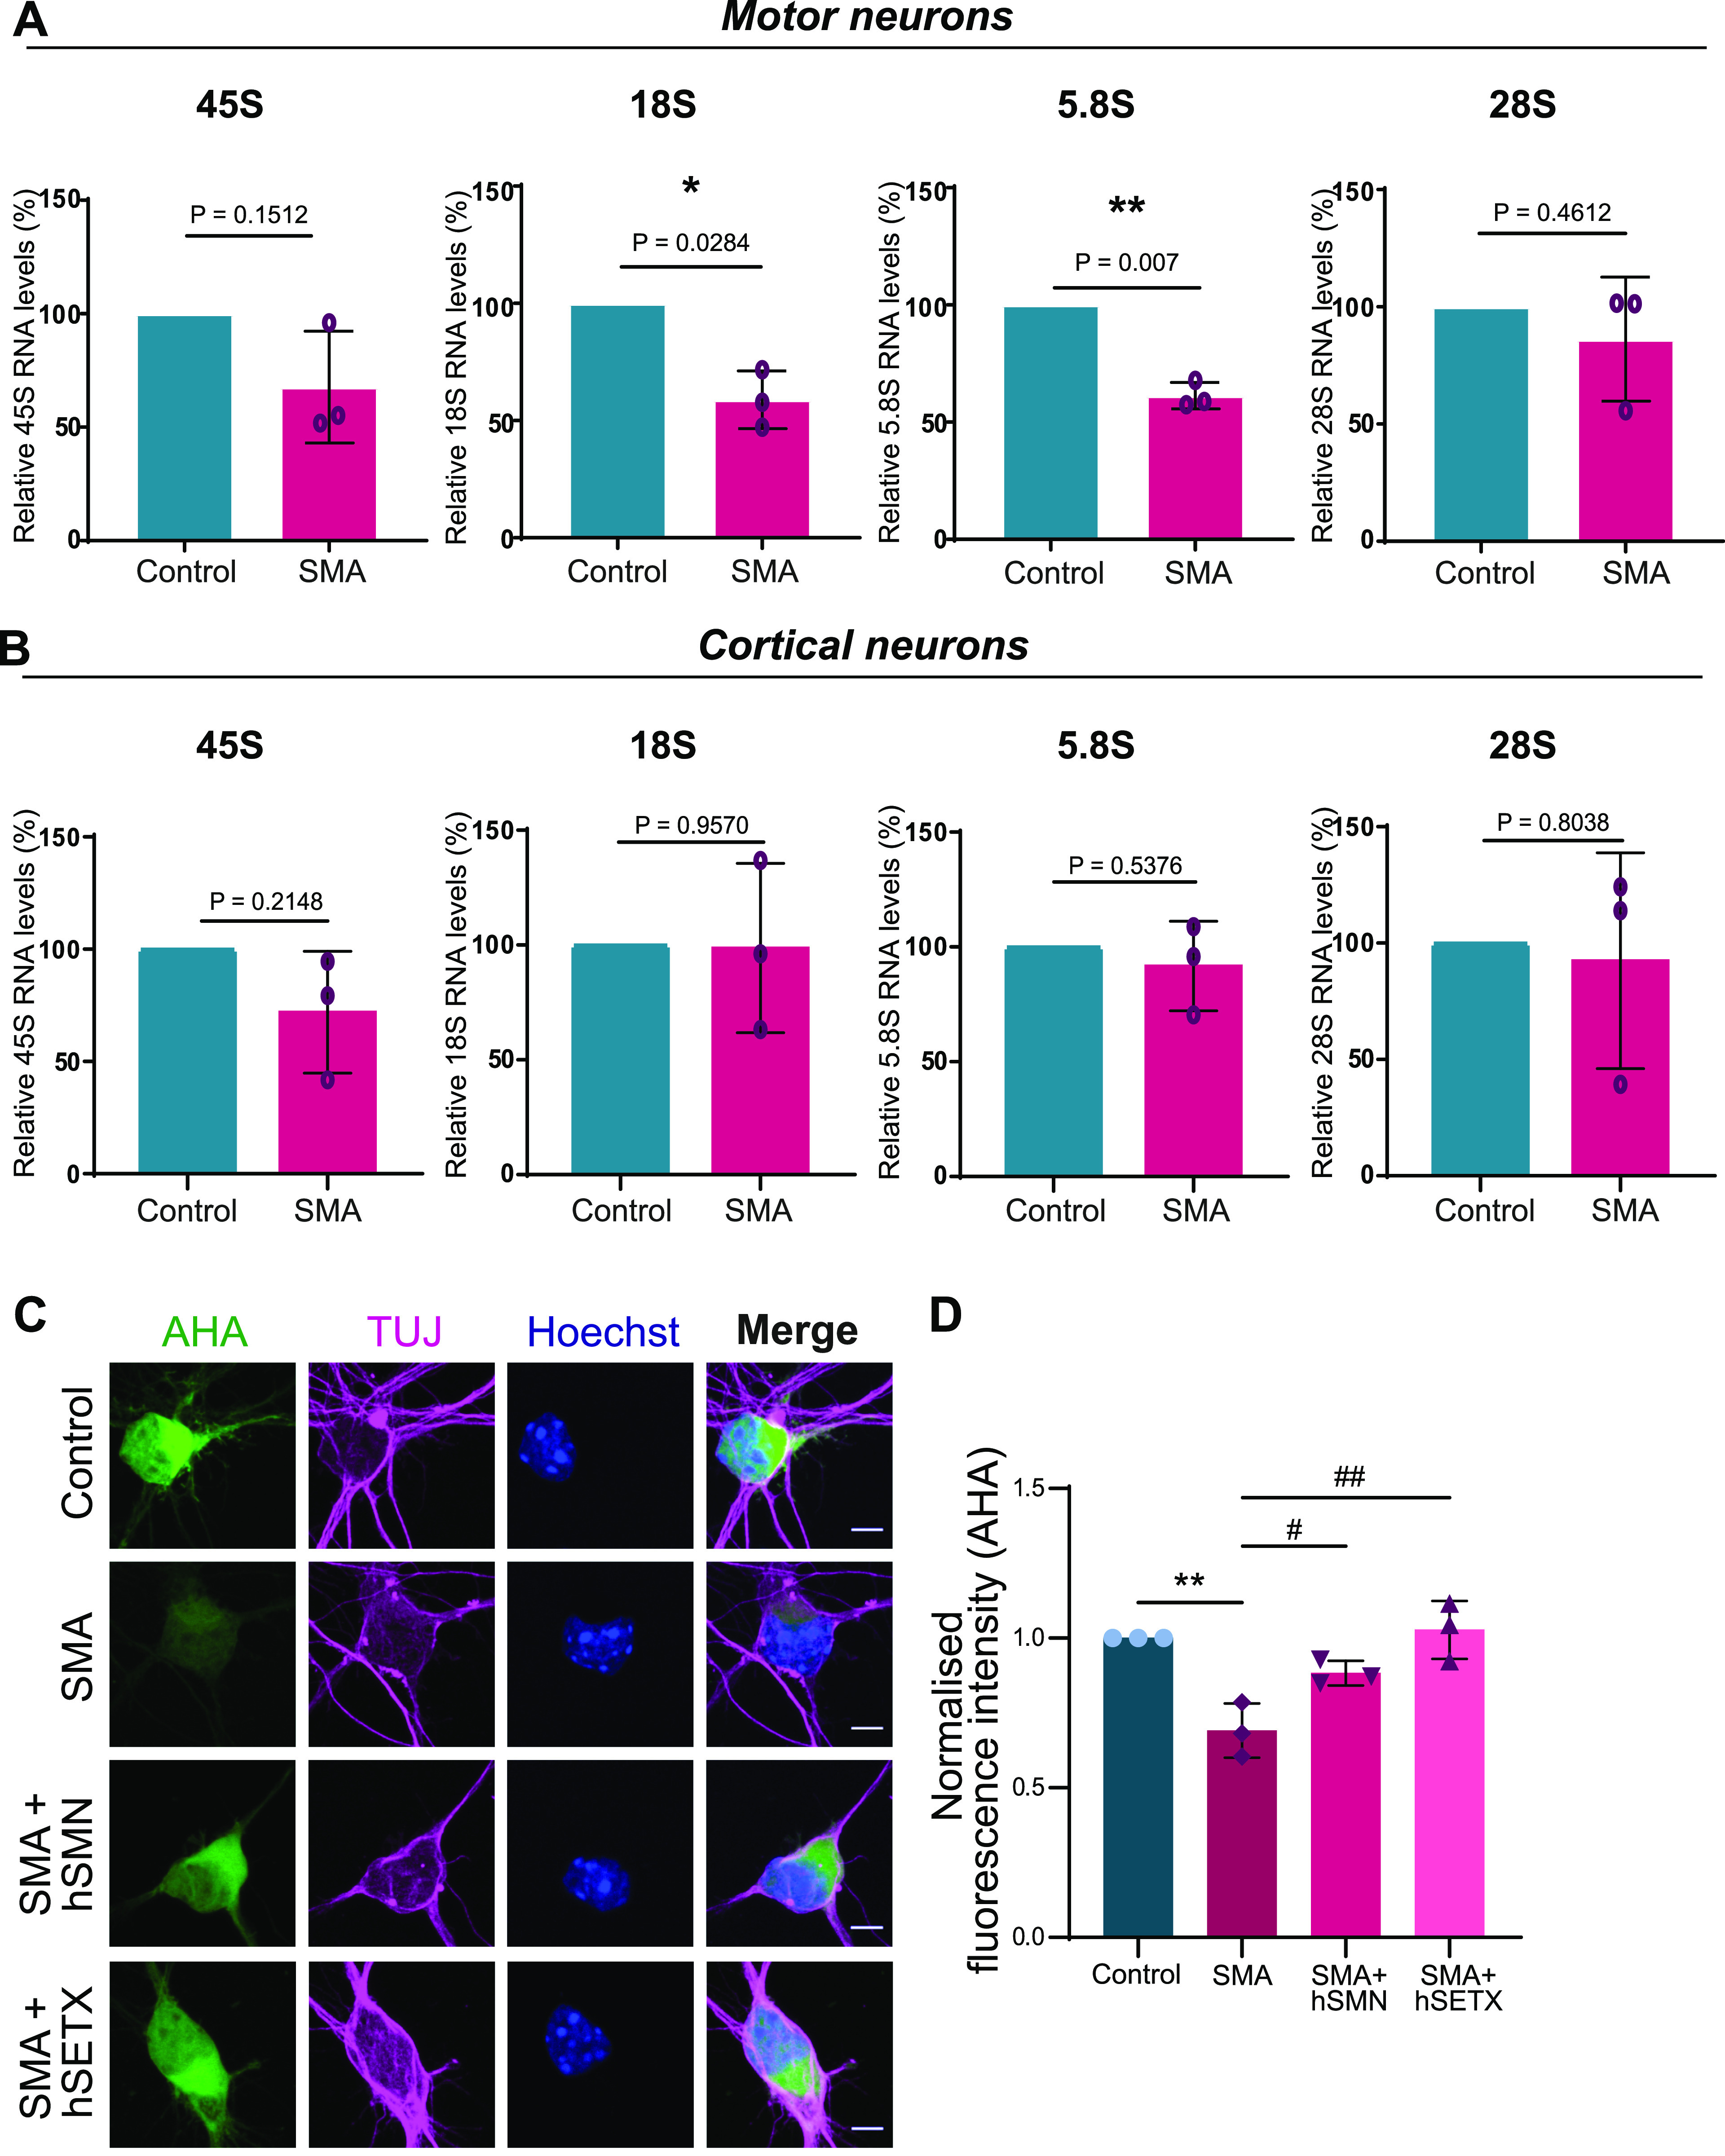
Figure 5. Ribosomal DNA damage leads to impaired ribosomal RNA (rRNA) synthesis and translation.

(A) Analysis of rRNA synthesis. Total RNA was extracted from spinal muscular atrophy (SMA) and control embryonic motor neurons. The levels of 45S pre-rRNA along with 18S, 5.8S, and 28S mature rRNAs were determined by quantitative reverse transcription PCR (qRT-PCR) and normalised to GAPDH levels. Data are presented as mean ± SEM (N = 3). *P < 0.05, **P < 0.01 paired two-tailed t test; P = 0.1512 (45S), P = 0.0284 (18S), P = 0.007 (5.8S), P = 0.4612 (28S). (B) Total RNA was extracted from SMA and control embryonic cortical neurons. The levels of 45S pre-rRNA along with 18S, 5.8S, and 28S mature rRNAs were determined by qRT-PCR and normalised to GAPDH levels. Data are presented as mean ± SEM. (N = 3). Paired two-tailed t test; P = 0.2148 (45S), P = 0.9570 (18S), P = 0.5376 (5.8S), P = 0.8083 (28S). (C) SMA and control embryonic motor neurons were stained to reveal overall morphology (beta-III-tubulin, magenta) and nuclear integrity (Hoechst, blue). Protein synthesis was visualized by labelling newly synthesized proteins with L-azidohomoalanine (AHA, green). SMA motor neurons were transduced with Ad-hSETX or lentiviral vector survival motor neuron (SMN) FL before staining. Scale bars represent 10 μm. (D) AHA fluorescence intensity values normalised to control samples. Bar graphs of mean ± SEM #P < 0.05 (comparing SMA cells treated with lentiviral vector-SMN and SMN untreated cells), ##P < 0.01 (comparing SMA cells treated with Ad-SETX and SMA untreated cells) and **P < 0.01 (comparing SMA and control untreated cells). One-way ANOVA analysis followed by Tukey’s multiple comparisons test; F (1.615, 3.229) = 13.79. P = 0.0273. The data were collected from N = 3 and were normally distributed.
