
Figure S2. R-loops in spinal muscular atrophy mouse spinal cords.
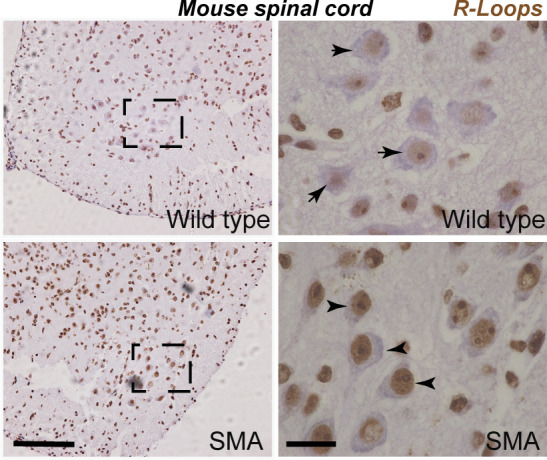
Lumbar spinal cord sections from postnatal day 2 SMNΔ7 and wild-type mice subjected to S9.6 staining reveals increased R-loop formation in spinal muscular atrophy mice (arrowheads) compared with wild-type controls (arrows) in the early stages of disease. Scale bars represent 50 μm (left image) and 10 μm (right image), respectively.