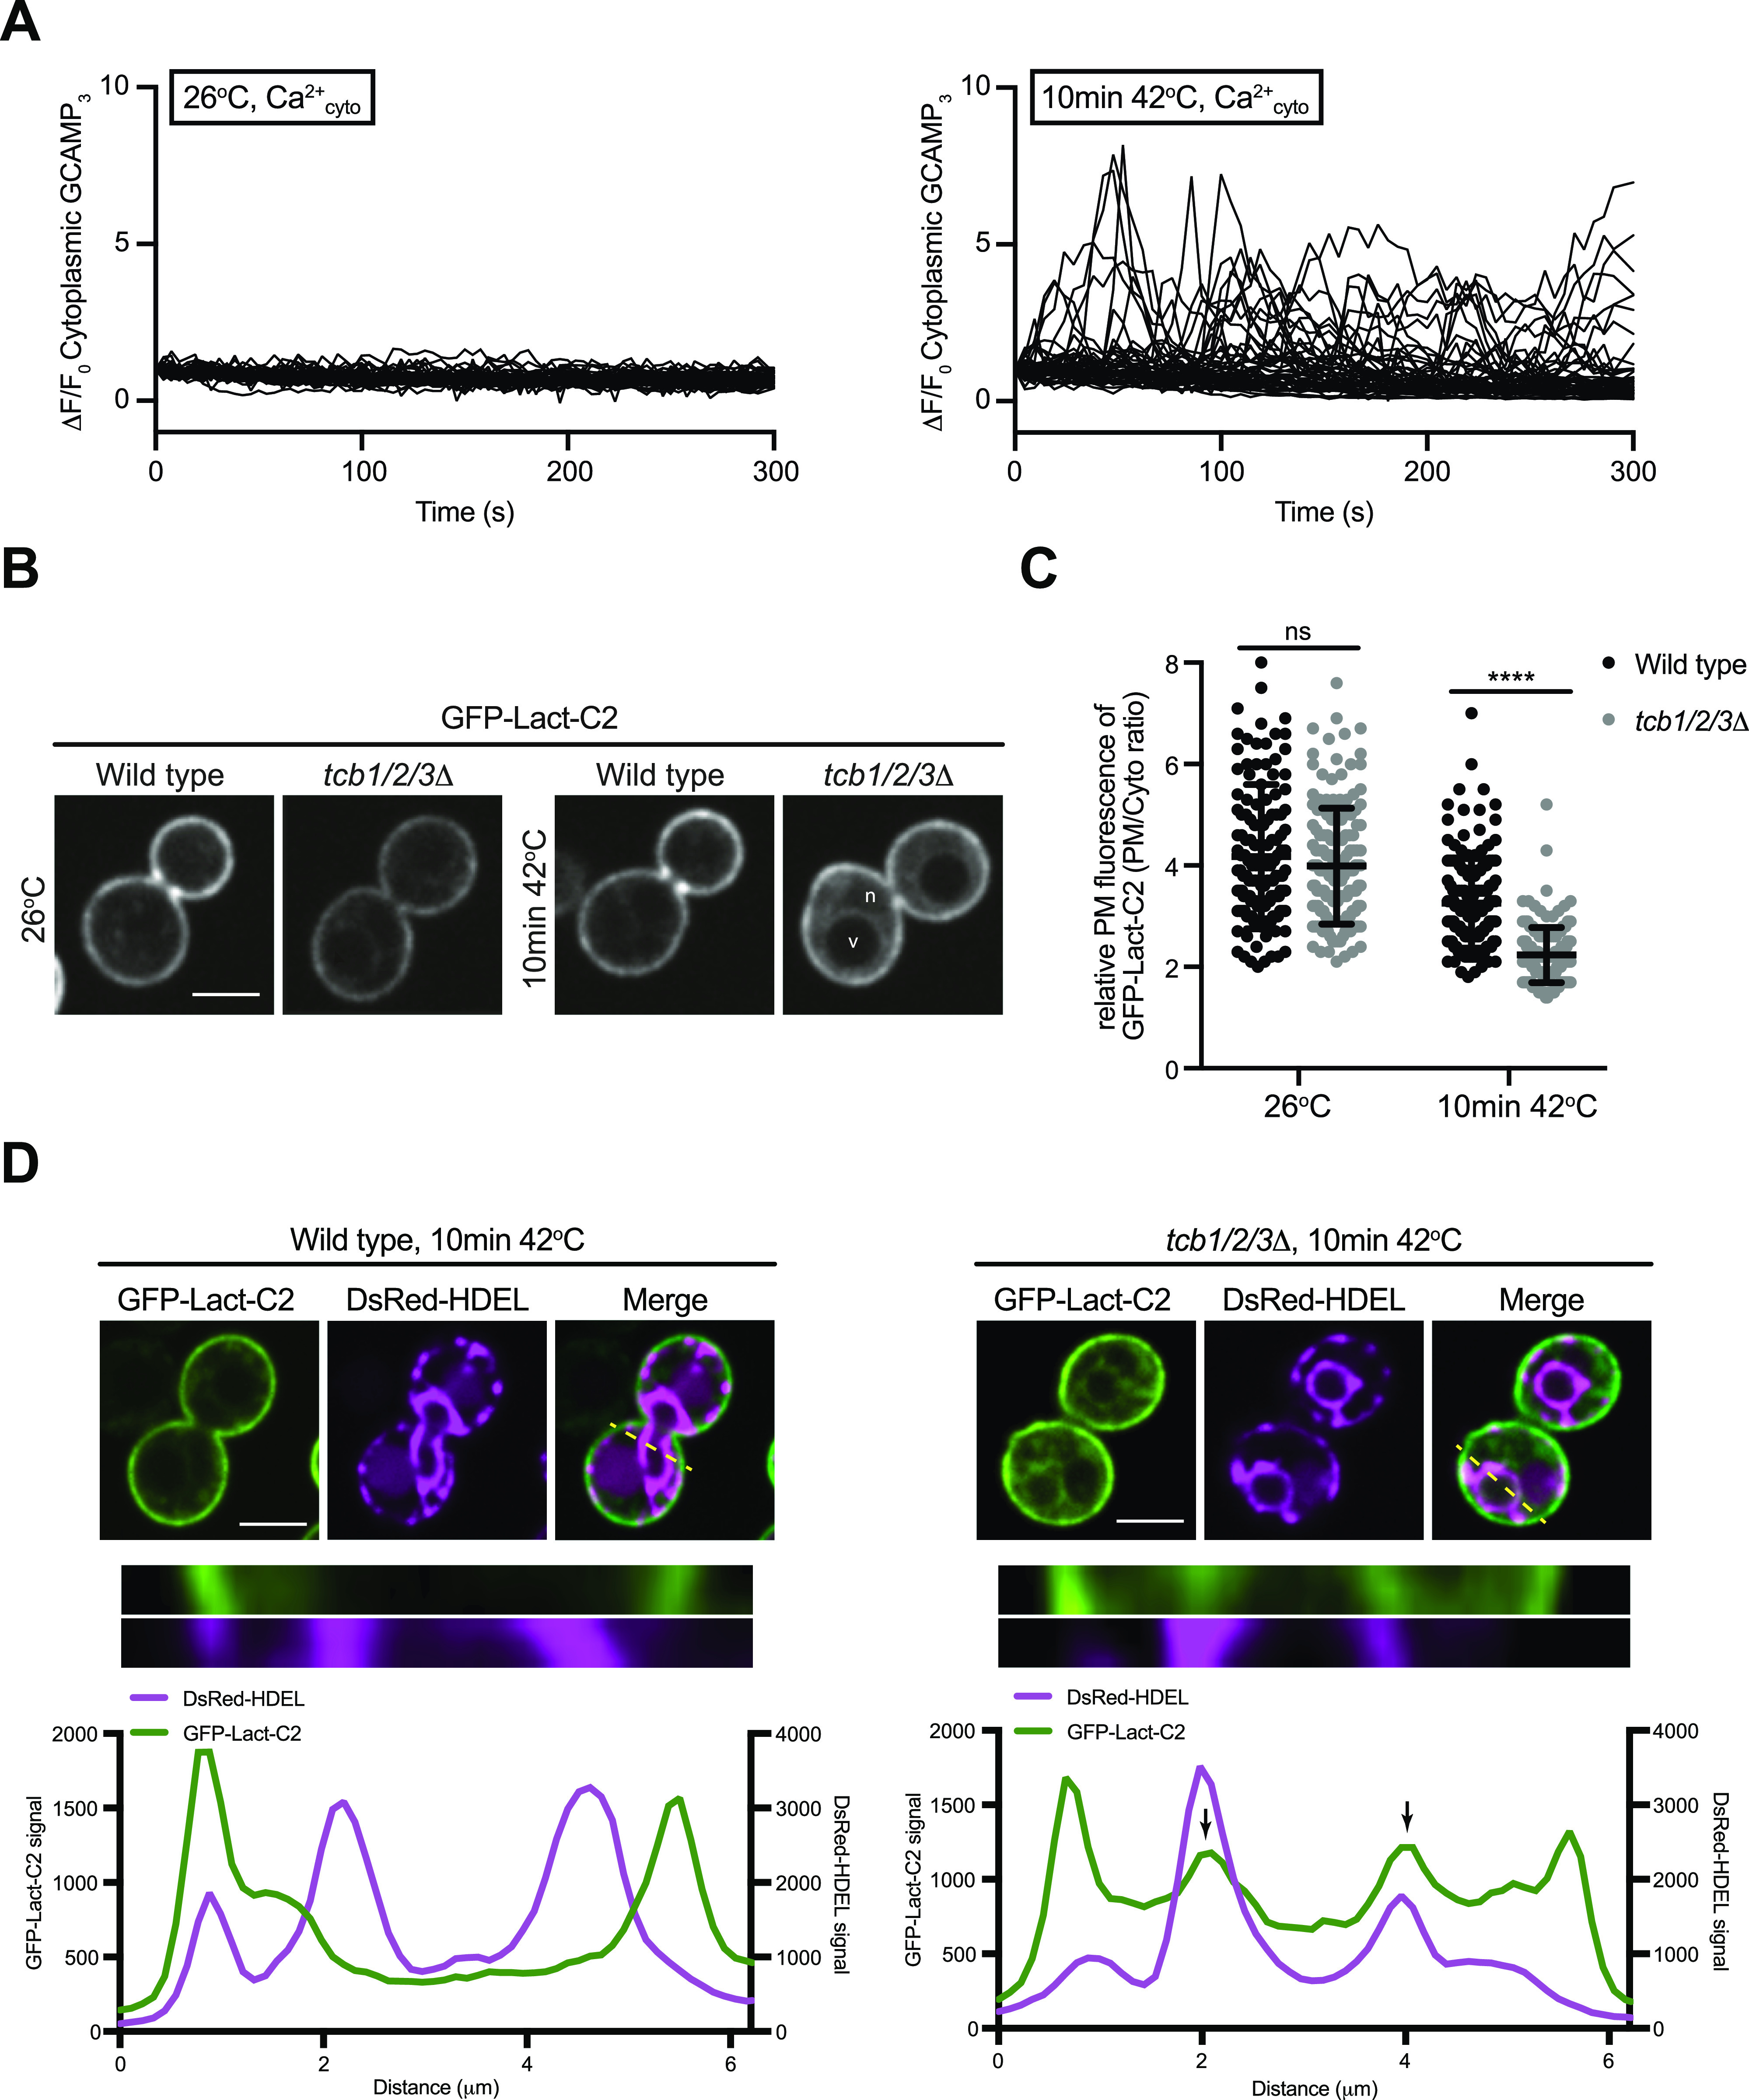
Figure 3. The tricalbins control phosphatidylserine distribution upon heat stress conditions.
(A) Normalised fluorescence (ΔF/F0) traces of wild-type cells expressing a cytoplasmic Ca2+ sensor, GCAMP3 imaged at 26°C or following a 10-min incubation at 42°C. Each line represents an individual cell, 49 (top) and 48 (bottom) traces for each condition. (B) PS FLARE (GFP-Lact-C2) localisation in wild-type and tcb1/2/3Δ cells at 26°C or after 10 min at 42°C. Scale bar, 4 μm. (C) Quantitation of relative GFP-Lact-C2 levels at the plasma membrane at 26°C and after 10 min at 42°C in wild-type and tcb1/2/3Δ cells. Data represent mean ± SD. Total number of cells analysed in three independent experiments: wild type 26°C n = 153, wild type 10 min 42°C n = 152, tcb1/2/3Δ 26°C n = 152, tcb1/2/3Δ 10 min 42°C n = 151 cells. ****P > 0.0001. (D) GFP-Lact-C2 localisation in wild type (left) and tcb1/2/3Δ (right) cells, co-expressing the ER marker DsRed-HDEL (magenta), after 10 min at 42°C. Top panels: representative midsection images. Scale bar, 4 μm. Bottom panels: linearised signal (yellow dotted line on midsection images) through the plasma membrane and nER and representative graphs showing the intensity profiles for both channels. Arrows indicate peaks in the GFP-Lact-C2 signal that relate to the nER. Also see Fig S3.
Source data are available for this figure.

