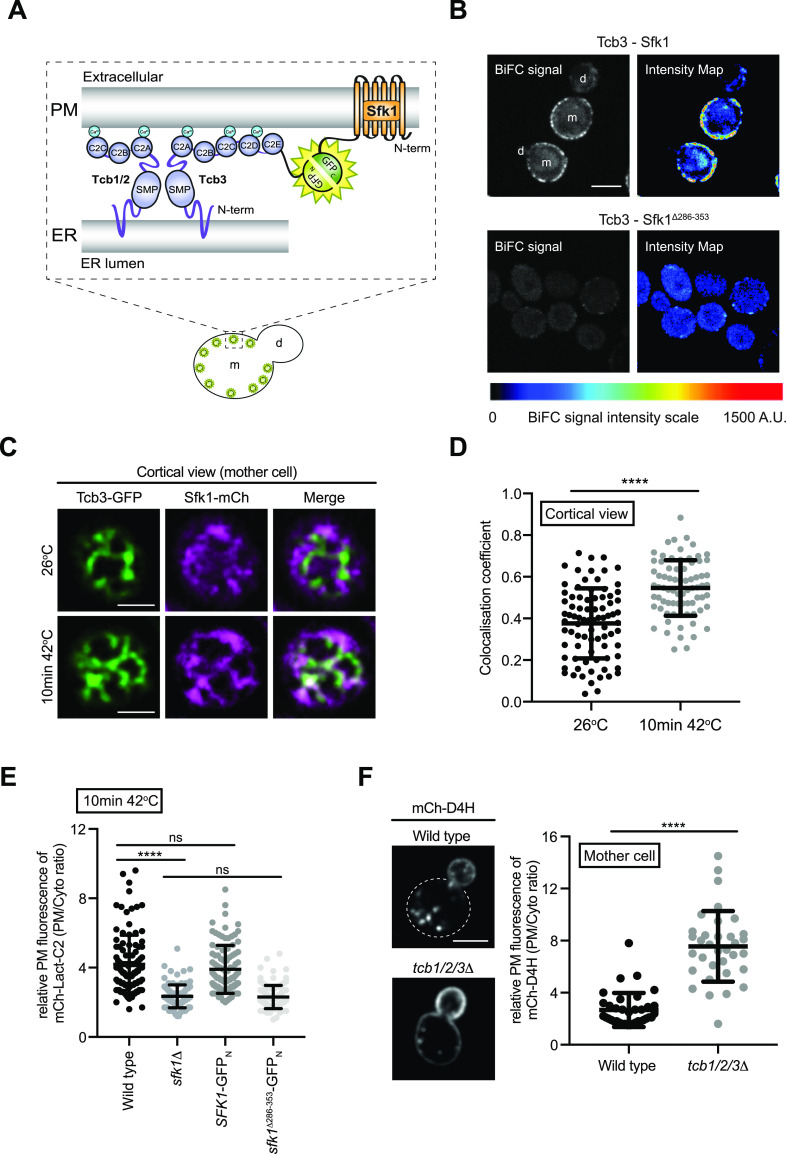
Figure 4. ER-localised Tcb3 associates with Sfk1 at the plasma membrane (PM).
(A) Cartoon displaying the bi-molecular fluorescence (BiFC) split GFP assay to assess Tcb3-Sfk1 proximity. The N-terminal half of GFP (GFPN) and the C-terminal half of GFP (GFPC) form a fluorescent GFP only when their fusion partners, in this case Tcb3 and Sfk1, are in close spatial proximity with each other. m, mother cell; d, daughter cell. (B) Tcb3-GFPN associates with Sfk1-GFPC but not with a mutant Sfk1 lacking its cytoplasmic C terminus (Sfk1Δ286-353-GFPC). The pseudo-coloured images indicate the scale of specific BiFC signals (blue, moderate; red, strong). m, mother cell; d, daughter cell. Scale bars, 4 μm. (C) Cortical localisation of Tcb3-GFP and Sfk1-mCherry at 26°C or after 10 min at 42°C in the mother cell. Scale bars, 4 μm. (D) Quantitation of Tcb3-GFP and Sfk1-mCherry co-localisation (Pearson’s coefficient) at 26°C or after 10 min at 42°C. Data represent mean ± SD. Total number of cells analysed in three independent experiments: wild type n = 82, tcb1/2/3Δ n = 75. ****P > 0.0001. (E) Quantitation of relative mCh-Lact-C2 levels at the PM after 10 min at 42°C in wild type, sfk1Δ, Sfk1-GFPN, Sfk1Δ286-353-GFPN cells. Data represent mean ± SD. Total number of cells analysed in three independent experiments: wild type n = 106, sfk1Δ n = 99, Sfk1-GFPN n = 96 cells, Sfk1Δ286-353-GFPN n = 105 cells. ****P > 0.0001; ns, not significant. (F) Sterol FLARE (mCh-D4H) localisation in wild-type and tcb1/2/3Δ cells. Left panel: representative midsection images. Mother cell PM of wild-type cells is indicated by a dotted line. Scale bar, 4 μm. Right panel: quantitation of relative mCh-D4H levels at the PM in wild type and tcb1/2/3Δ cells. Data represent mean ± SD. Total number of cells analysed in three independent experiments: wild type n = 36, tcb1/2/3Δ n = 34 cells. ****P > 0.0001. Also see Fig S4.
Source data are available for this figure.

