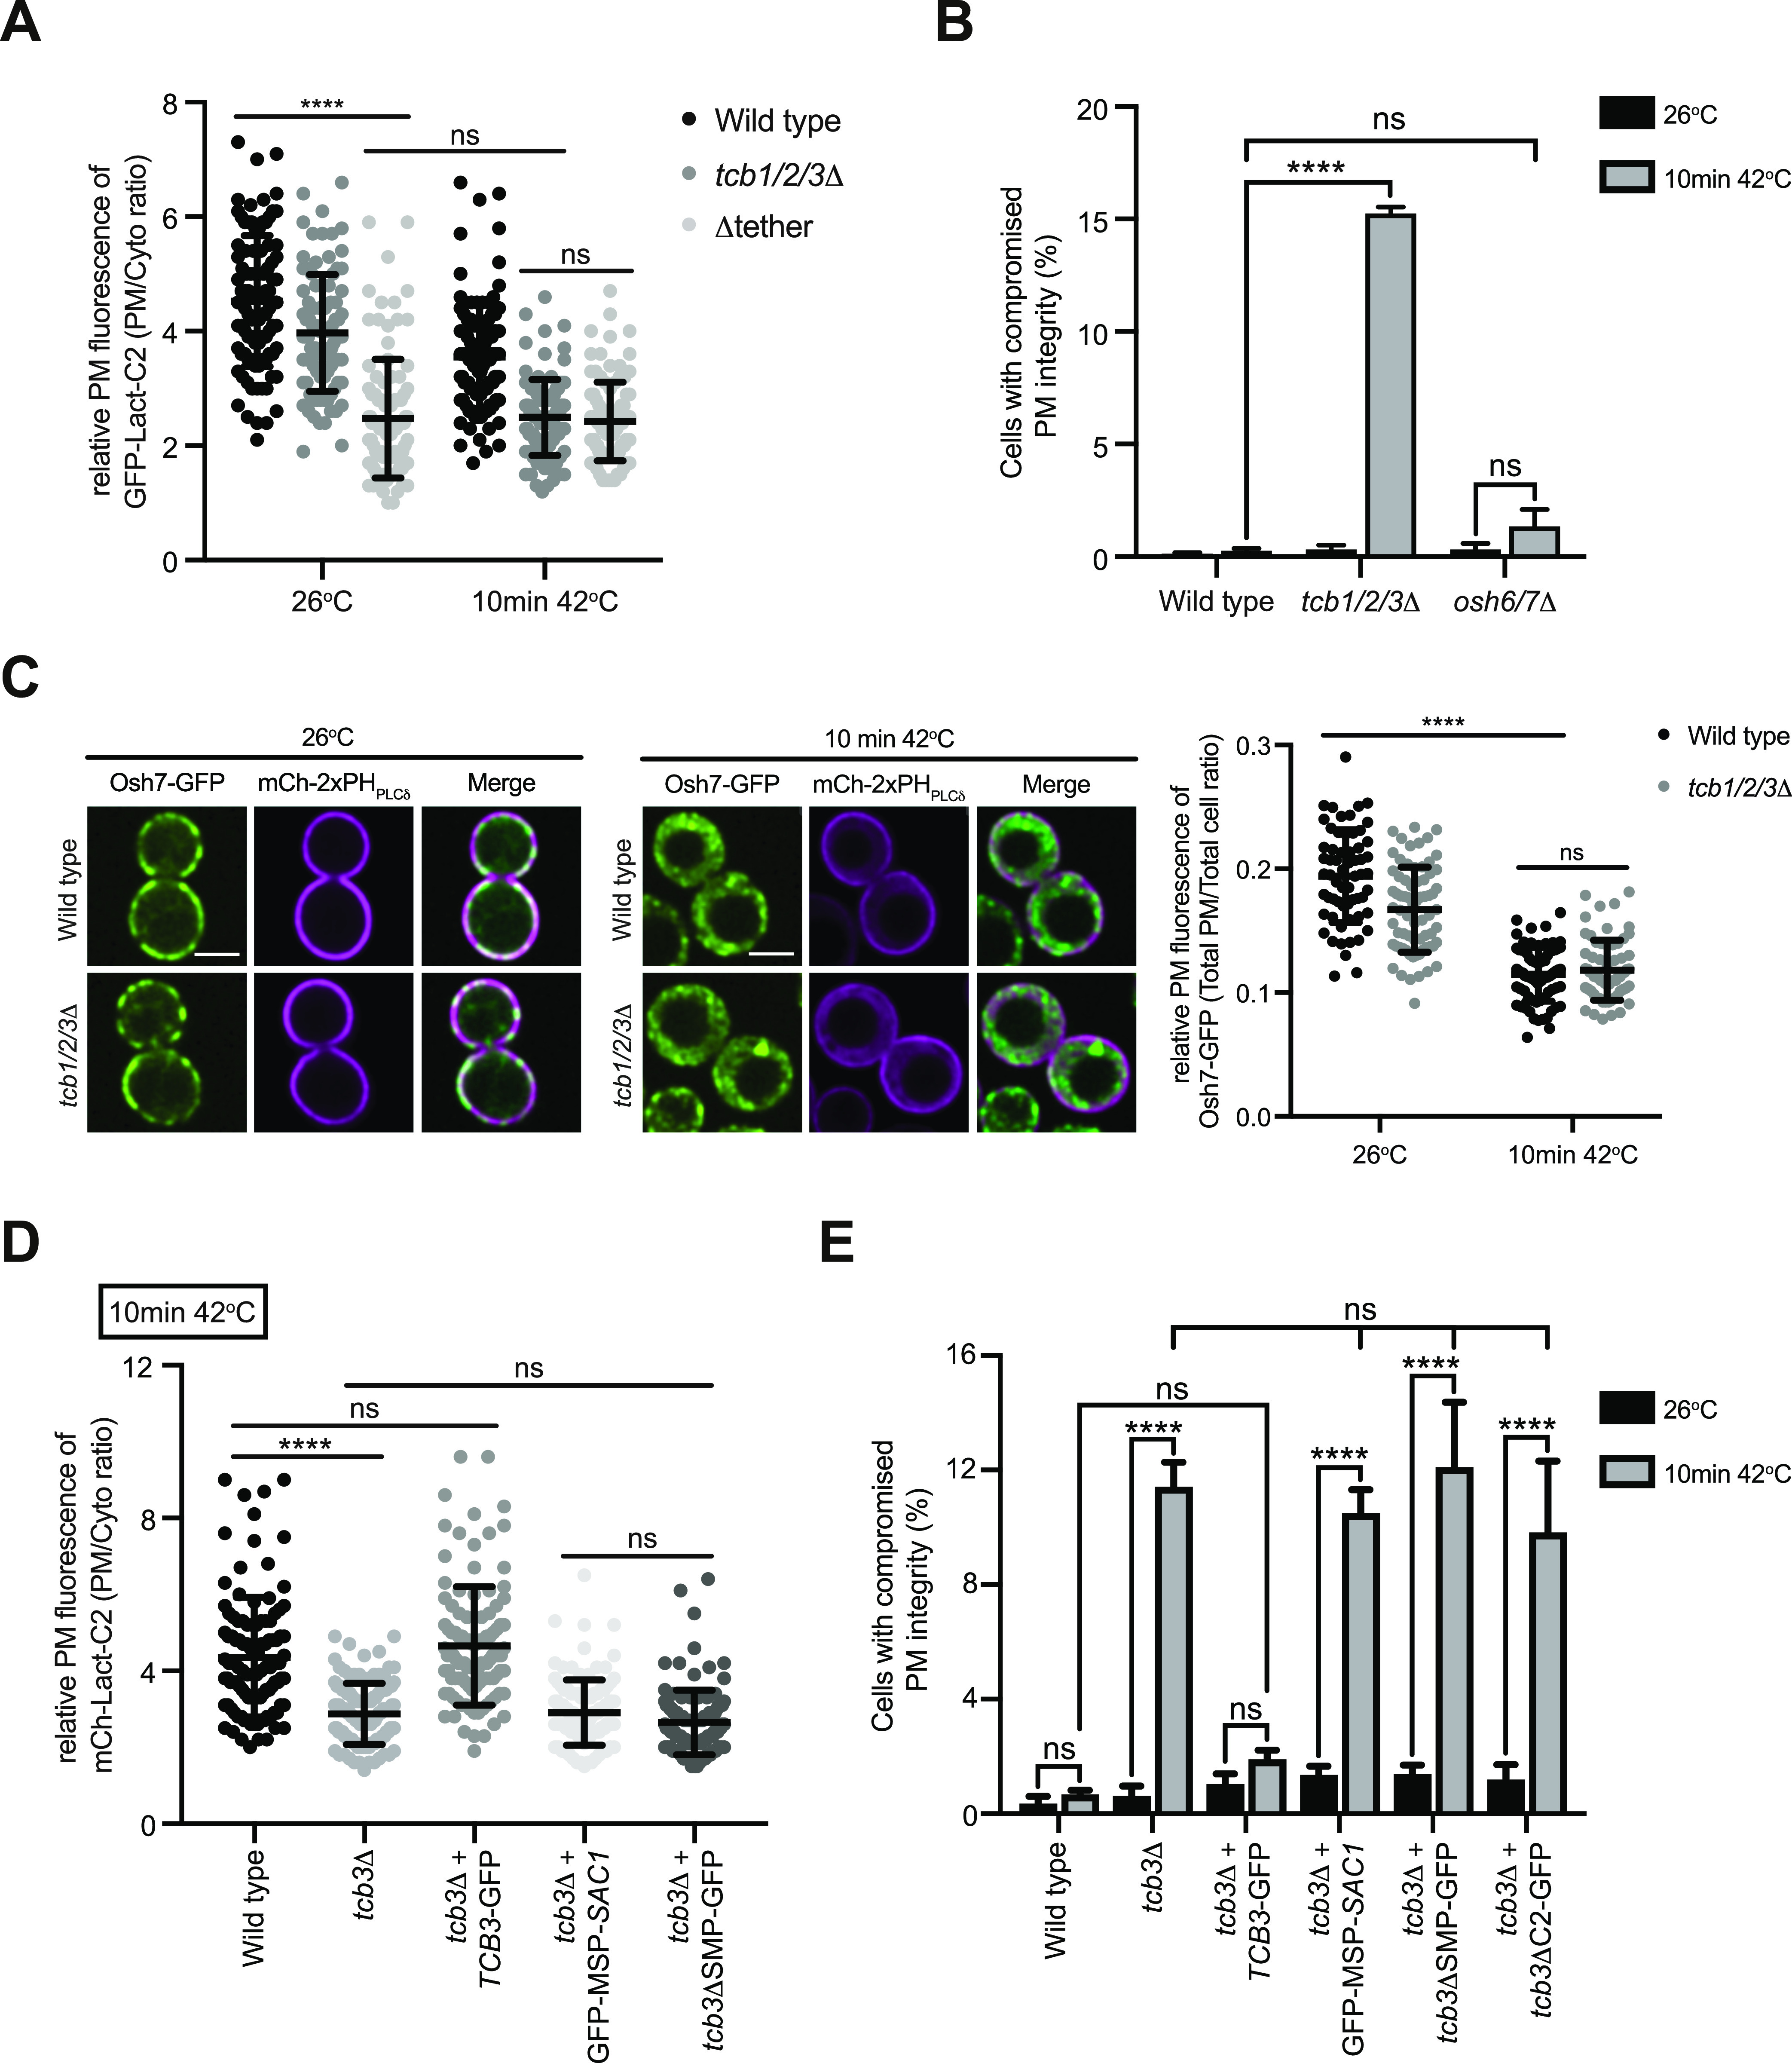
Figure 7. Lipid transfer proteins Osh6 and Osh7 are not necessary for plasma membrane (PM) integrity, but the SMP domain of Tcb3 is required for PS distribution and PM integrity upon heat stress.
(A) Quantitation of relative GFP-Lact-C2 levels at the PM in wild-type, tcb1/2/3Δ, and Δtether cells at 26°C or after 10 min at 42°C. Data represent mean ± SD. Total number of cells analysed in three independent experiments: all strains and conditions n = 100. ****P > 0.0001; ns, not significant. (B) PM integrity assays of wild type, tcb1/2/3Δ and osh6/7Δ cells. Cells incubated at 26°C or 42°C for 10 min were subsequently incubated with propidium iodide and measured by flow cytometry (50,000 cells measured per experiment). Data represent mean ± SD from four independent experiments. ****P > 0.0001; ns, not significant. (C) Left and middle panels: Osh7-GFP (green) localisation in wild-type and tcb1/2/3Δ mutant cells, co-expressing the PM marker mCh-2xPHPLCδ (magenta), at 26°C (left) and following a brief heat stress (10 min at 42°C) (middle). Scale bar, 4 μm. Right panel: quantitation of relative Osh7-GFP levels at the PM in wild-type and tcb1/2/3Δ cells at 26°C or after 10 min at 42°C. Data represent mean ± SD. Total number of cells analysed in four independent experiments: wild type 26°C n = 61, wild type 10 min 42°C n = 76, tcb1/2/3Δ 26°C n = 71, tcb1/2/3Δ 10 min 42°C n = 76 cells. ****P > 0.0001; ns, not significant. (D) Quantitation of relative GFP-Lact-C2 levels at the PM in wild type, tcb3Δ, and tcb3Δ cells expressing TCB3-GFP, a mutant Tcb3 fusion lacking the SMP domain (tcb3ΔSMP-GFP), or an artificial ER–PM tether (GFP-MSP-SAC1) (Manford et al, 2012) after 10 min at 42°C. Data represent mean ± SD. Total number of cells analysed in three independent experiments: wild type n = 108, tcb3Δ n = 116, tcb3Δ + TCB3-GFP n = 108, tcb3Δ + tcb3ΔSMP-GFP n = 112, tcb3Δ + GFP-MSP-SAC1 n = 112. ****P > 0.0001; ns, not significant. (E) PM integrity assays of wild-type, tcb3Δ, and tcb3Δ cells complemented with TCB3-GFP, TCB3-GFP truncation mutants (tcb3ΔSMP-GFP or tcb3ΔC2-GFP), or GFP-MSP-SAC1. Cells incubated at 26°C or 42°C for 10 min were subsequently incubated with propidium iodide and measured by flow cytometry (50,000 cells measured per experiment). Data represent mean ± SD from three independent experiments. ****P > 0.0001; ns, not significant. Also see Fig S7.
Source data are available for this figure.

