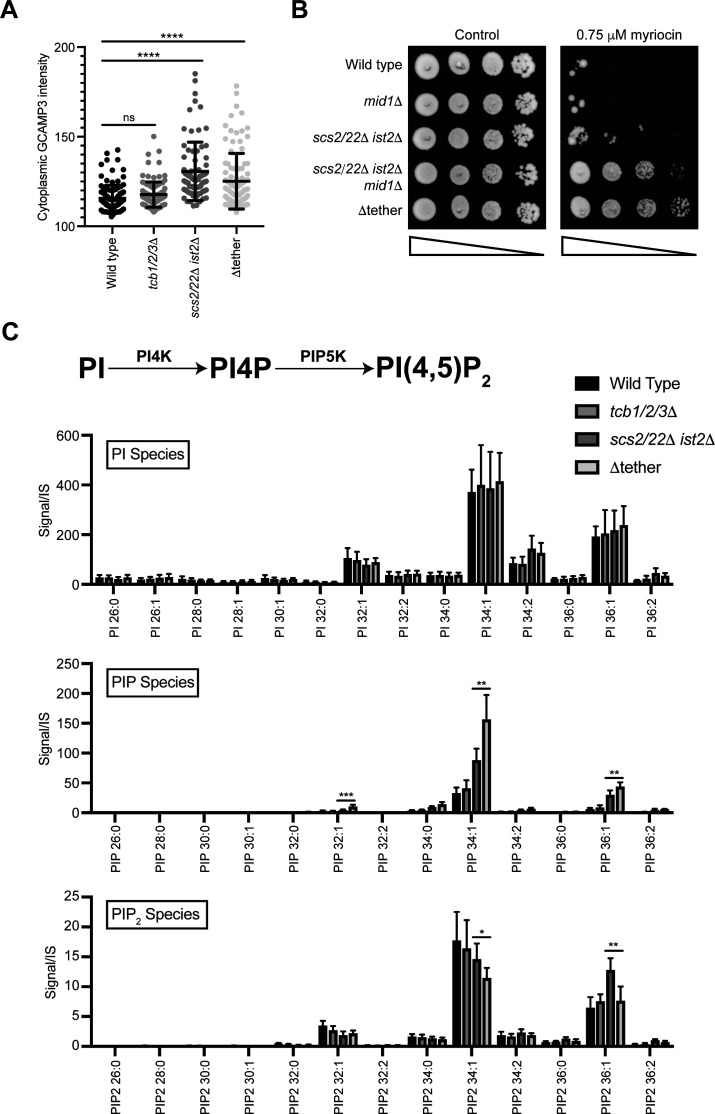
Figure S1. Lipidomic analyses of individual phosphoinositide species in the various ER–plasma membrane tether mutants.
(A) Quantitation of GCaMP3 signal in the cytosol in wild-type, tcb1/2/3Δ, scs2/22 ist2Δ, and Δtether cells measured by fluorescence microscopy. Data represent mean ± SD. Total number of cells analysed in three independent experiments: wild type = 109, tcb1/2/3Δ = 103, scs2/22 ist2Δ = 97, Δtether = 100. ****P = 0.0001; ns, not significant. (B) Serial dilutions (10-fold) of wild type, mid1Δ, scs2/22Δ ist2Δ, scs2/22Δ ist2Δ mid1Δ, and Δtether cells spotted on agar media ± 0.75 μM myriocin. (C) Top: schematic representation of PI4P and PI(4,5)2 production from PI and the kinases involved. Bottom: levels of PI, PIP, and PIP2 species in wild-type, tcb1/2/3Δ, scs2/22Δ ist2Δ, and Δtether cells. Data represent mean ± SD (N = 5). *P > 0.1, **P > 0.01.
Source data are available for this figure.

