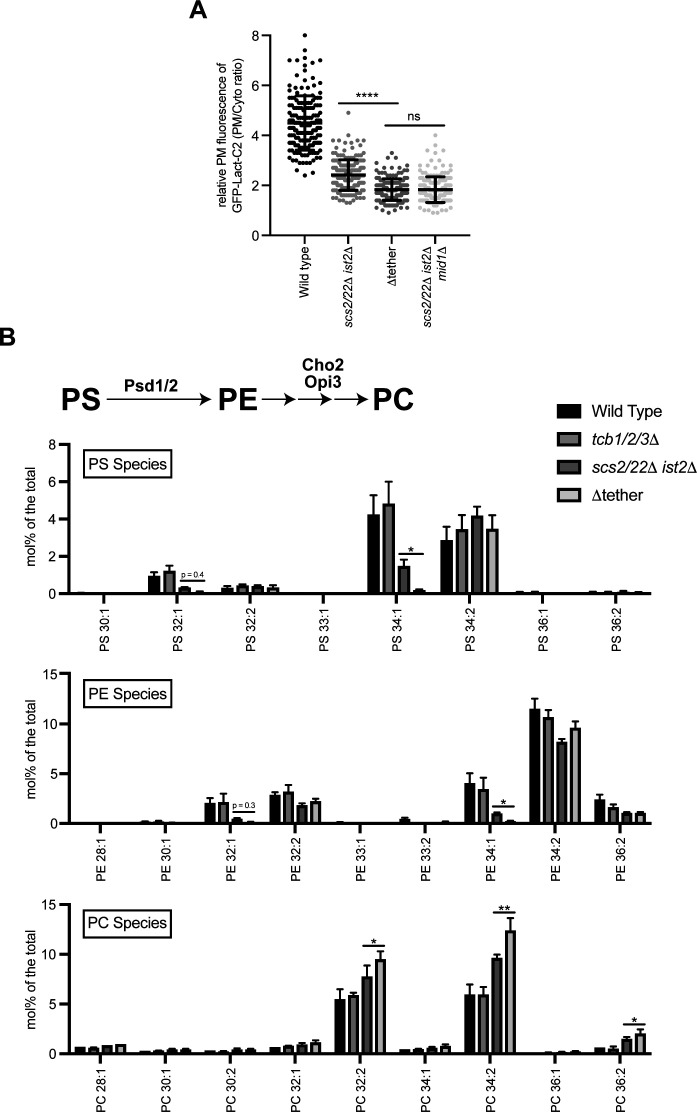
Figure S2. Lipidomic analyses of individual PS, PE, and PC species in the various ER–plasma membrane tether mutant strains.
(A) Quantitation of the PS FLARE (GFP-Lact-C2) intensity at the plasma membrane of wild-type, scs2/22Δ ist2Δ, Δtether, and scs2/22Δ ist2 mid1Δ cells. Data represent mean ± SD. Total number of cells analysed in three independent experiments: wild type n = 172, scs2/22Δ ist2Δ n = 178, Δtether n = 177, scs2/22Δ ist2Δ mid1Δ n = 181. ****P > 0.0001. (B) Top: schematic representation of PE and PC production from PS and the enzymes involved. Bottom: levels of PS, PE, and PC species in wild type, tcb1/2/3Δ, scs2/22Δ ist2Δ, and Δtether cells. Data represent mean ± SD (N = 3). *P > 0.1, **P > 0.01.
Source data are available for this figure.

