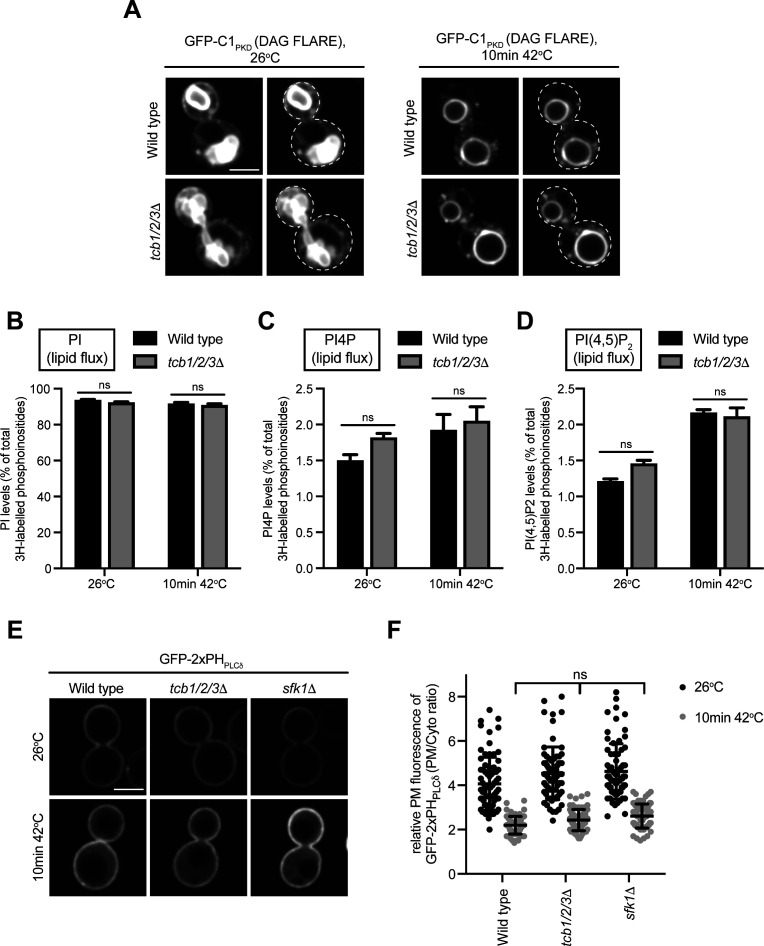
Figure S5. Metabolism of phosphatidylinositol species remtains intact in tcb1/2/3Δ and sfk1Δ mutant cells upon heat stress.
(A) DAG FLARE (GFP-C1PKD) localisation in wild-type and tcb1/2/3Δ cells at 26°C and after 10 min at 42°C. The plasma membrane is indicated by a dotted line in the left-hand images. Scale bar, 4 μm. (B, C, D) Cellular PI, PI4P and PI(4,5)P2 levels at 26°C and after 10 min at 42°C in wild-type and tcb1/2/3Δ cells, as measured by 3H-inositol labelling and HPLC analysis. Data represent mean ± SD from three independent experiments. ns, not significant. (E) PI(4,5)P2 FLARE (GFP-2xPHPLCδ) localisation in wild type, tcb1/2/3Δ, and sfk1Δ cells at 26°C or after a brief heat stress (10 min 42°C). Scale bar, 4 μm. (F) Quantitation of relative GFP-2xPHPLCδ levels at the plasma membrane at 26°C and after 10 min at 42°C in wild-type, tcb1/2/3Δ, sfk1Δ cells. Data represent mean ± SD. Total number of cells analysed in three independent experiments: wild type, 26°C n = 74, wild type, 10 min 42°C n = 73, tcb1/2/3Δ, 26°C n = 71 cells, tcb1/2/3Δ, 10 min 42°C n = 68 cells, sfk1Δ, 26°C n = 70 cells, sfk1Δ, 10 min 42°C n = 72 cells. ns, not significant.
Source data are available for this figure.

