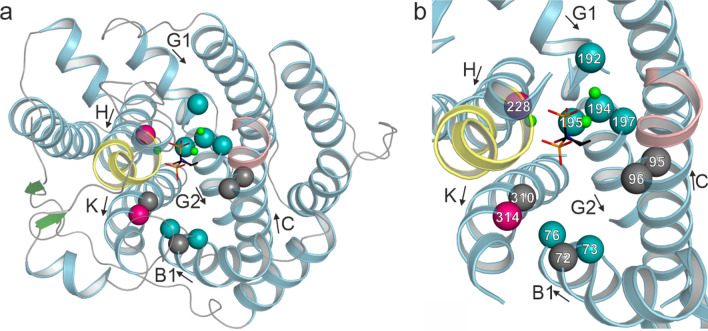
Fig. 5.
Location of residues subjected to mutagenesis. a The same perspective and color-coding as in Fig. 3b were used. α-Helices are drawn as spirals. Identical amino acids between Copu3 and Copu9 are indicated as grey spheres. Residues that have been subjected to mutagenesis without altering the product are shown as teal-colored spheres. Single amino acid exchanges with an effect on the product profile are drawn as magenta-colored spheres. b Magnified view into the active site (same perspective and color coding as in panel a), with residues numbered

