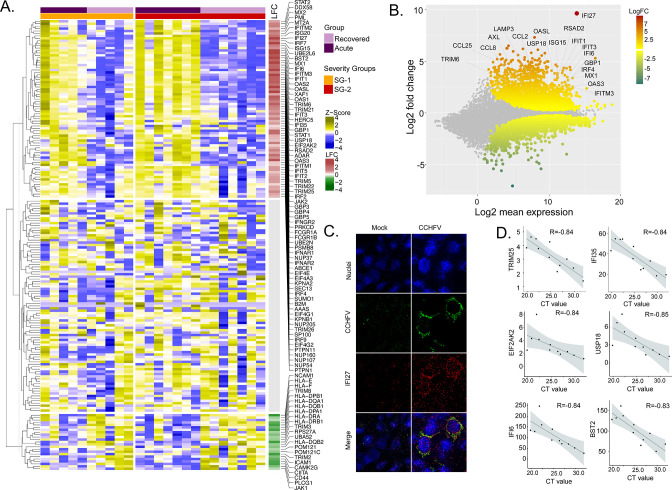
Figure 2. Differentially expressed genes in interferon (IFN) signaling pathways.
(A) Heatmap visualizes the expression pattern of IFN-signaling genes (including ISGs) significantly different between the recovered and acute phases. The columns represent the patient samples and their corresponding severity groups at different time points. The rows represent genes hierarchically clustered based on Euclidean distance. (B) MA-plot of differentially regulated genes between the recovered and acute phases. ISGs are marked. (C) RNAscope analysis targeting IFI27 genes in infected and non-infected cells. (D) Spearman correlation between viral load and IFN signaling genes (adj p < 0.05).

