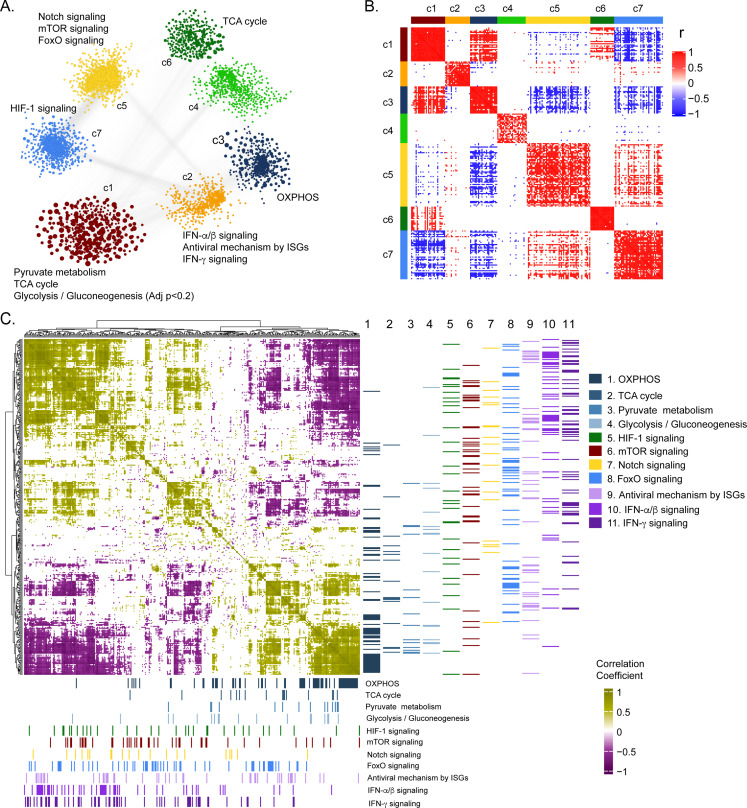
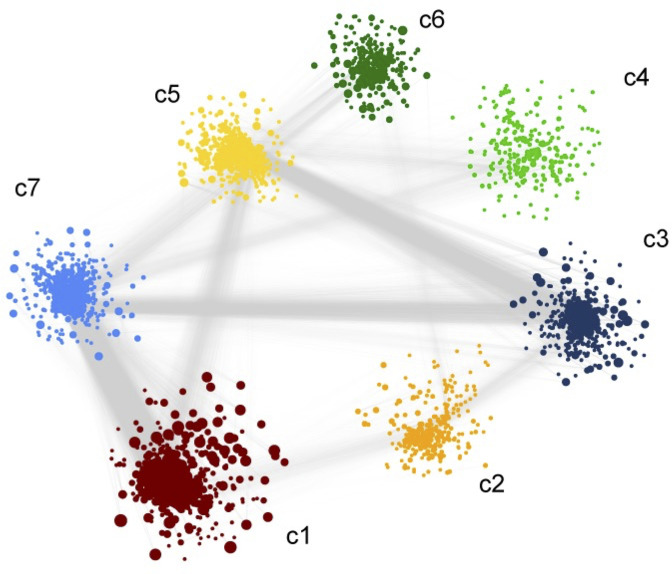
Figure 3. Weighted co-expression network analysis.
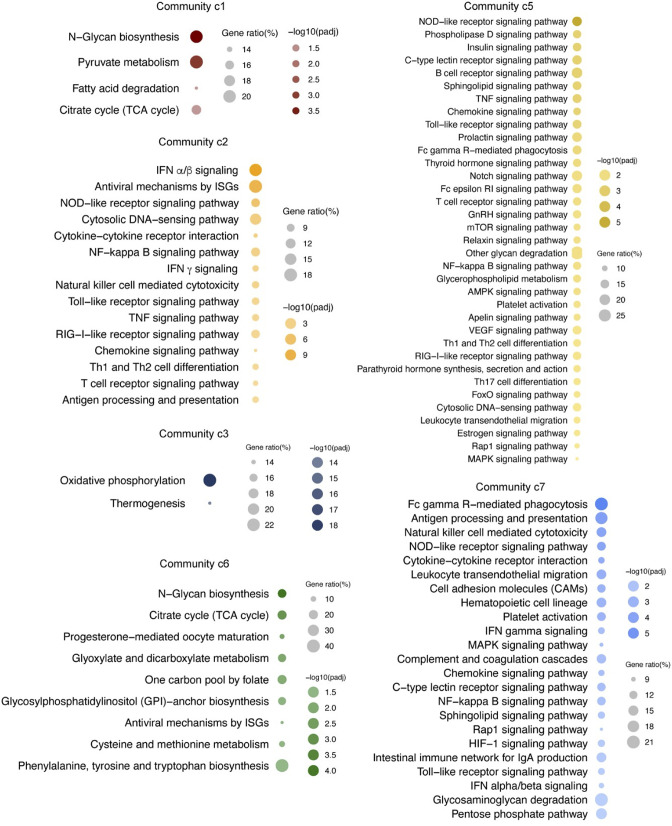
(A) Network visualization of seven gene co-expression communities identified. Nodes and node size represent genes and their centrality (degree) respectively and edges represent significant Spearman correlation (adj p < 0.001 and R > 84). Key significantly regulated pathways (adj. p < 0.05) in each community are labeled. (B) Heatmap of correlations among top 5% central genes in each community. Column and row annotation denotes corresponding communities. (C) Heatmap of significant correlation (adj. p < 0.05) between key metabolic and signaling pathways mentioned in (A). Column and row annotation denotes corresponding pathways.


