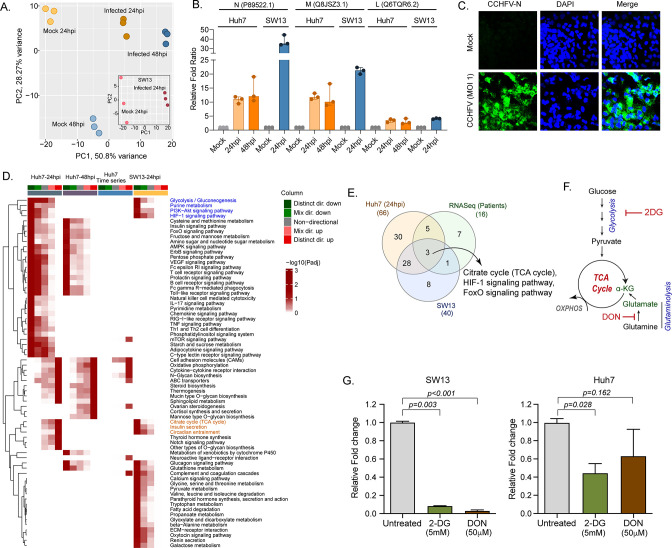
Figure 4. LC-MS/MS-based quantitative proteomics analysis in CCHFV-infected Huh7 and SW13 cells.
(A) Principal component analysis of proteomics samples of Huh7 cells and SW13 (inset) using only human proteins. (B) Identification of the CCHFV N (UniProtKB P89522.1), M (UniProtKB Q8JSZ3.1) and L (UniProtKB Q6TQR6.2) protein in the quantitative proteomics analysis. (C) Immunofluorescence staining of the CCHFV nucleoprotein to assess the infectivity. (D) Significantly regulated pathways (adj p < 0.05) in any of the pair-wise proteomics analyses in Huh7 and SW13 cells. The heatmap visualizes negative log scaled adjusted p-values of different directionality classes. Non-directional p-values are generated based on gene-level statistics alone without considering the expression direction. The mixed-directional p-values are calculated using subset of gene-level statistics of up and down-regulated genes respectively for mixed-directional up and down. Distinct directional up and distinct directional down p-values are calculated from gene statistics with expression direction. The first column annotation represents directionality of pathways and second column annotation denotes corresponding differential expression analysis. (E) Venn diagram showing commonly dysregulated pathways in patients transcriptomics and cell line proteomics. (F) Schematic diagram of the glycolysis and glutaminolysis and targeted drugs. (G) Metabolic control of viral replication in vitro. Fold change of the CCHFV L-gene following infection and treatment of 2-DG and DON at indicated concentrations compared to untreated in SW13 cells and Huh7 cells. A two-tailed paired Student t-test was performed, and p values are mentioned.


