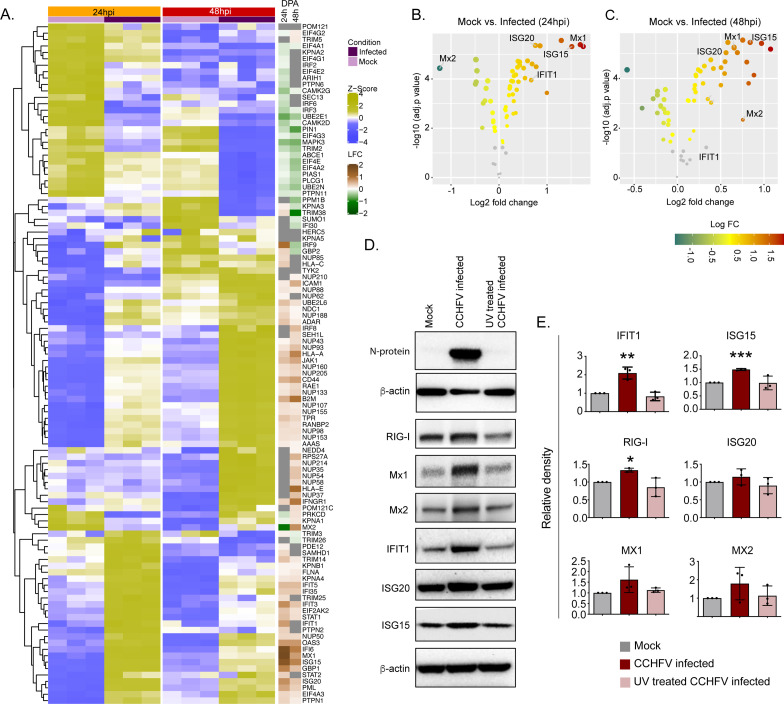
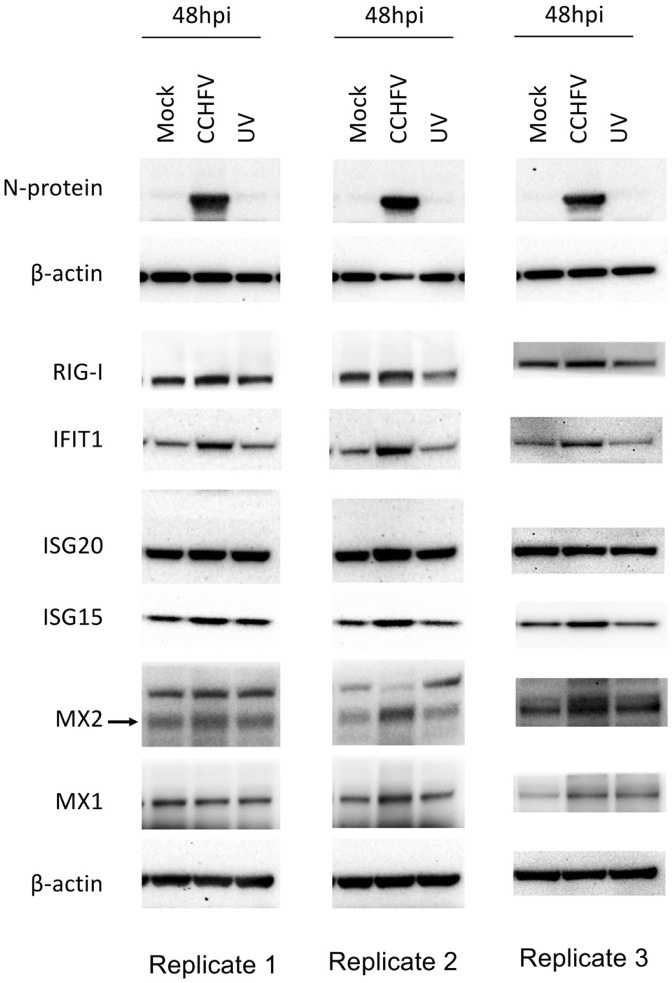
Figure 5. Temporal dynamics of interferon stimulating genes (ISGs).
(A) Heatmap of Z-score transformed expression values of proteins belonging to the cellular response to IFN signaling pathways in Mock-infected and CCHFV-infected Huh7 cells at 24hpi and 48hpi as identified in proteomics. The log-2-fold change in the genes corresponding to the indicated proteins identified in our patient transcriptomics data (recovered vs acute) is shown under the column name RNASeq. (B and C) Volcano plot of ISGs visualizing the expression status of Mock-infected and CCHFV-Infected samples at (B) 24hpi and (C) 48hpi. The size and color gradients of the dots correspond to the adjusted P values of differential expression analysis and the log2 fold change, respectively. (D) Representative western blots illustrate the indicated ISGs in Mock-infected, CCHFV-infected, and UV-inactivated CCHFV-infected Huh7 cells at 48hpi. ISG20 antibody gave a specific band at approx. 40 kDa without any non-specific band in the membrane that was cut at 50 kDa in the top. (E) The densitometric intensity of the bands was quantified using Fiji (ImageJ) software. The intensity of the individual bands was first normalized to the respective β-actin loading control and further relative normalization with respect to the mock-infected control was done. The bars are represented as means ± SD of three independent experiments. A two-tailed paired Student t-test was performed, and p values are represented as *p < 0.05, **p < 0.01 and ***p < 0.001.


