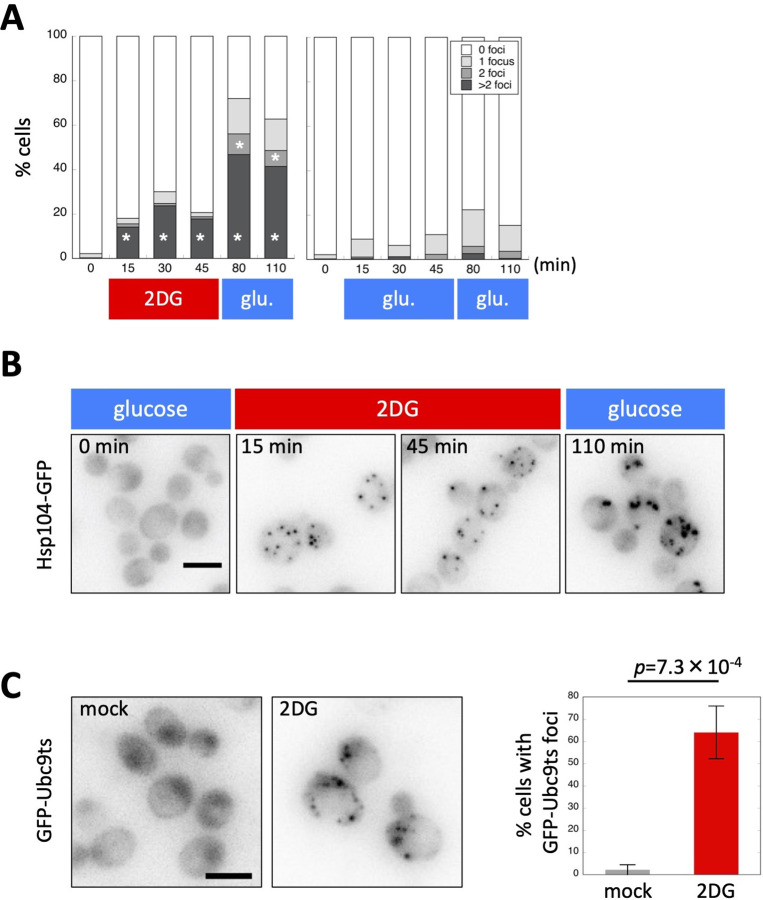
Figure 4. Adenosine triphosphate (ATP) depletion triggers protein aggregation in living yeast cells.
(A) The formation of Hsp104-GFP foci after ATP depletion. Wild-type cells expressing Hsp104-GFP were grown to the log phase at 35°C in medium containing 2% glucose. At the time point of 0 min, medium was replaced with 20 mM 2-deoxyglucose (2DG; red) or 2% glucose (as a control; blue). Cells were released back to media containing 2% glucose at the time point of 50 min. Cells were imaged at the indicated time points, classified, and scored according to the number of Hsp104-GFP foci. Values are the mean (N = 3). Asterisks indicate a significant difference from the 2% glucose treatment (p < 0.05). (B) Representative images of cells analyzed in (A). (C) Formation of Ubc9-ts foci after ATP depletion. Cells expressing GFP-Ubc9-ts under an inducible GAL promoter were grown in medium containing 2% galactose (SC-gal) at 33°C, and medium was then exchanged with 2DG or SC-gal. After 30 min, cells were imaged and scored for the number of GFP-Ubc9-ts foci. Representative images (inverted grayscale) are shown on the left and summarized on the right. Values are the mean ± 1SD (error bars) (N = 4). White scale bar = 5 µm.


