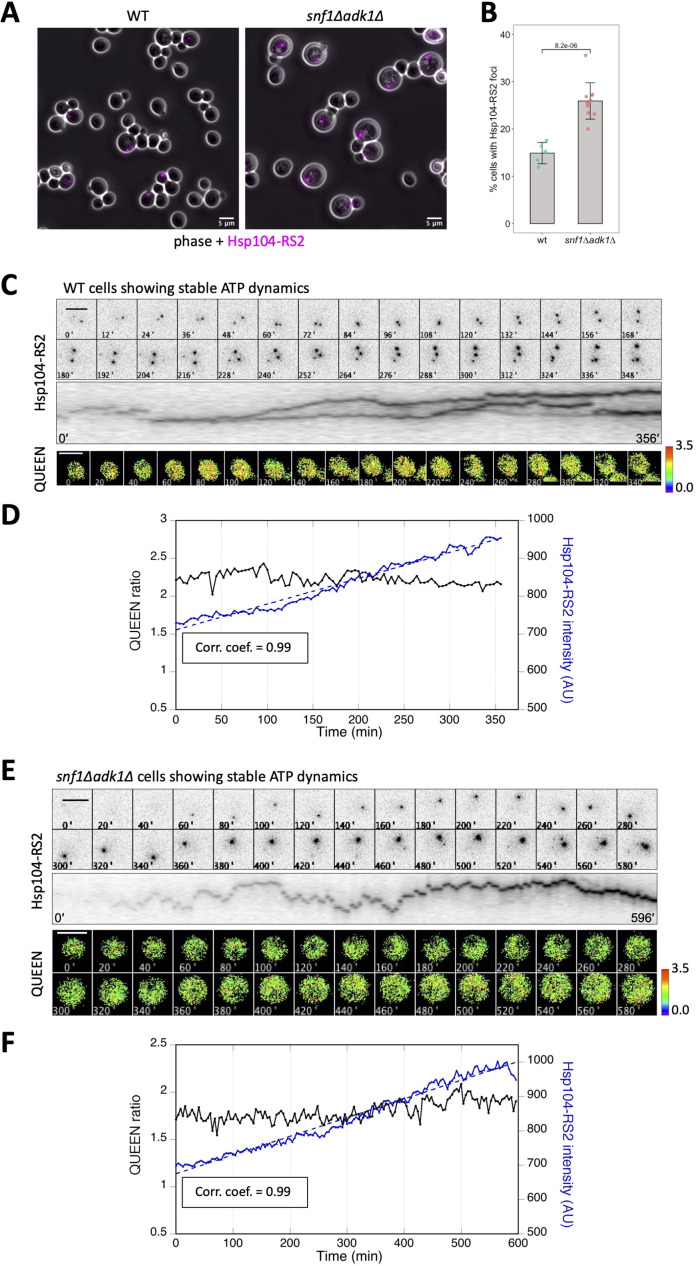
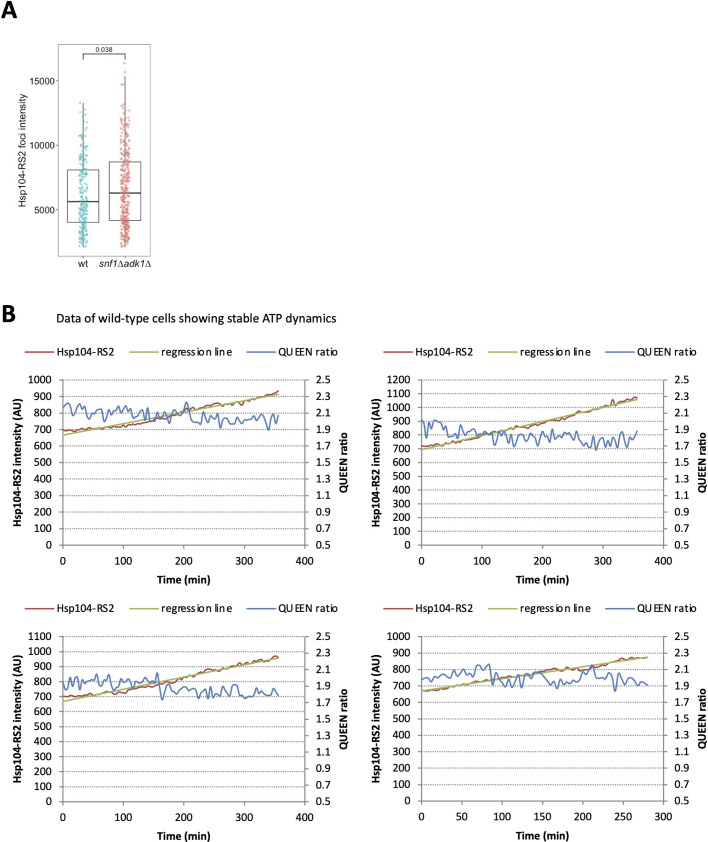
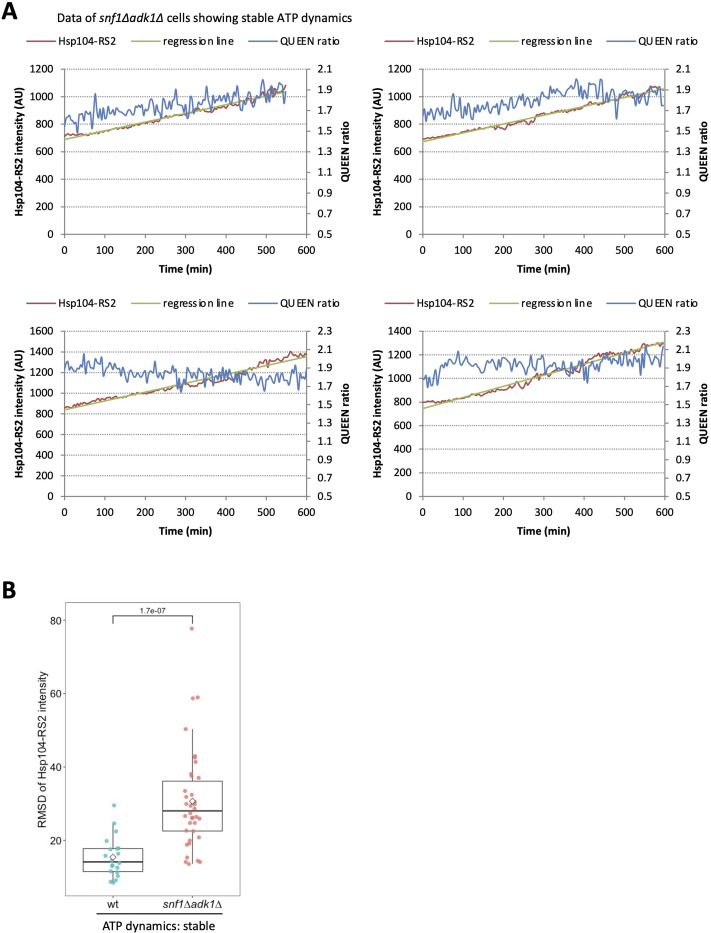
Figure 6. The intracellular fluorescence intensity of Hsp104-RS2 increased linearly and slowly in cells showing stable adenosine triphosphate (ATP) dynamics.
(A) Formation of Hsp104-RS2 foci in wild-type and snf1∆ adk1∆ cells. The RFP signal (magenta) was imaged in log-phase cells grown at 25°C in medium containing 2% glucose. (B) Fraction of cells showing Hsp104-RS2 foci. The percentages of cells with Hsp104-RS2 foci per one field of view (containing 70–342 cells) were plotted. Bars and error bars indicate the mean ± 1SD. The significance of differences was tested using the unpaired two-tailed Welch’s t-test and indicated by the p value. (C) Time-lapse imaging of QUEEN and Hsp104-RS2 in a wild-type cell. (Top) Images of the Hsp104-RS2 signal (inverted grayscale) in the cell at the indicated time points are shown. (Middle) Kymograph of the images shown in the top panel. (Bottom) QUEEN ratio images of the cell. (D) The mean QUEEN ratio and the mean fluorescence intensities of Hsp104-RS2 inside the cell were plotted over time. The dotted line indicates the best linear regression of Hsp104-RS2 intensities with a correlation coefficient of 0.99. (E) Time-lapse imaging of QUEEN and Hsp104-RS2 in an snf1∆ adk1∆ cell showing stable ATP dynamics. (Top) Images of the Hsp104-RS2 signal (inverted grayscale) in the cell at the indicated time points are shown. (Middle) Kymograph of the images shown in the top panel. (Bottom) QUEEN ratio images. (F) The mean QUEEN ratio and the mean fluorescence intensities of Hsp104-RS2 inside the cell were plotted over time. The dotted line indicates the best linear regression of Hsp104-RS2 intensities with a correlation coefficient of 0.99. Scale bar = 5 µm.


