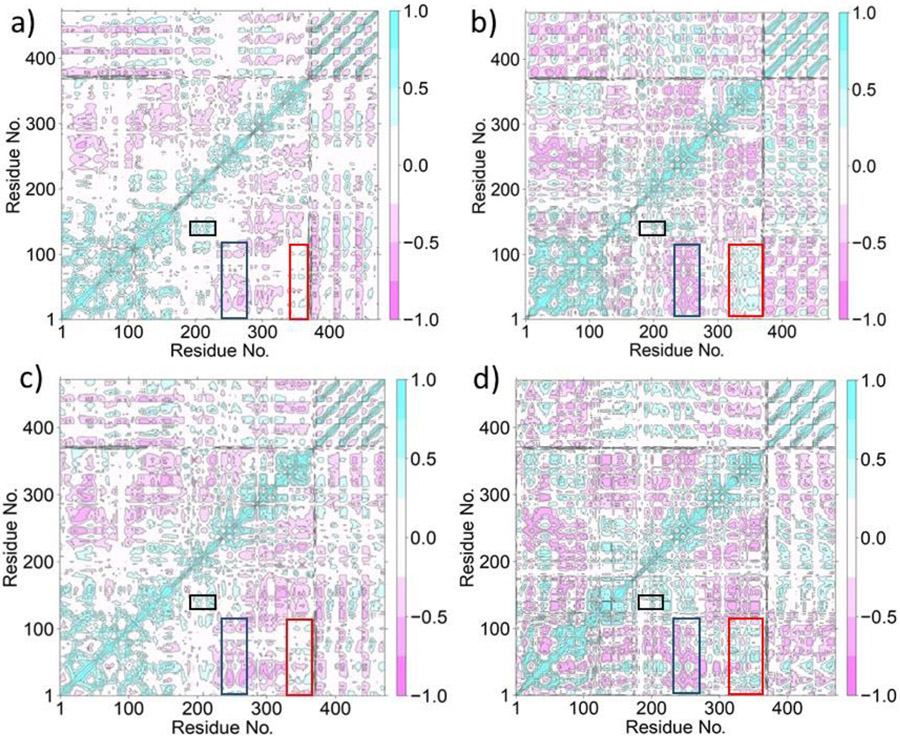
Fig. 7.
Dynamic Cross-Correlation Analysis of MMP-1•THP. a) (MMP1 Zn1 Zn2), b) (MMP1 Zn1), c) (MMP1 Zn2), and d) (MMP1 no Zn). The positive correlations (from 0 to 1.0) between residues are shown in cyan color and negative correlations (from 0 to −1.0) are represented in pink color. The boxes in the figure show the following important motions: Correlated motion between the S1' specificity loop and blade 1 residues (black), anticorrelated motion between the blade 2 residues and the CAT domain involving S-loop and V-B loop residues (blue), correlated motion between blade 4 residues and the CAT domain involving S-loop and V-B loop residues (red). Residues 1-162 (crystal structure numbers 81-242) denote the CAT domain, 179-367 (crystal structure numbers 259-447) denote the HPX domain, and 372-472 (crystal structure numbers 963-995) denotes the THP substrate.

